
Comparing Surface Finish: Fuse Series SLS, EOS SLS, HP MJF, and Form 4 SLA
As 3D printing becomes more commonly used as an end-use manufacturing method, surface finish quality becomes increasingly important. Though surface finish is indeed important for prototypes and manufacturing aids, these applications are typically low-volume, and extra post-processing work can be done to improve the surface finish of parts without exorbitant additional costs.
With 3D printing for end-use production possible thanks to larger build volumes, more efficient systems, more advanced materials, and lower materials costs, surface finish for end-use 3D printing applications is top of mind for many manufacturers. Here we compare four of the most popular 3D printers for functional, end-use parts: Formlabs Fuse Series selective laser sintering (SLS), EOS SLS, HP multi-jet fusion (MJF), and Formlabs Form 4 stereolithography (SLA) 3D printers.
Introduction
Background: Why Measure Surface Roughness?
In many additive manufacturing applications, the surface finish of 3D printed parts is as important a consideration as functional performance. Besides visual evaluation and comparison, however, there isn’t a wealth of quantitative information on how surface finish varies between technologies and brands of 3D printers.
This lack of data can be attributed to the difficulty of pinning down the exact cause of a specific difference or deficiency in surface finish — often a combination of printer, material, orientation, and post-processing method.
This white paper attempts to address this gap by setting up a quantitative comparison of the surface finish of four different 3D printers and different standards of post-processing. The four technologies chosen are four of the most popular 3D printers used for end-use manufacturing:
-
Formlabs Fuse Series selective laser sintering (SLS) printers with Nylon 12 Powder and both media blasting (standard) and polishing (extra) post-processing methods
-
EOS selective laser sintering (SLS) printers with Nylon 12 Powder and both media blasting (standard) and polishing (extra) post-processing methods
-
HP 5600 Series multi-jet fusion (MJF) printers with Nylon 12 and both media blasting (standard) and polishing (extra) post-processing methods
-
Formlabs Form 4 stereolithography (SLA) printers with Tough 2000 Resin and wash and cure (standard) post-processing methods
The materials chosen for each technology are those most commonly used for end-use consumer goods and the most closely comparable to each other.
Results Summary
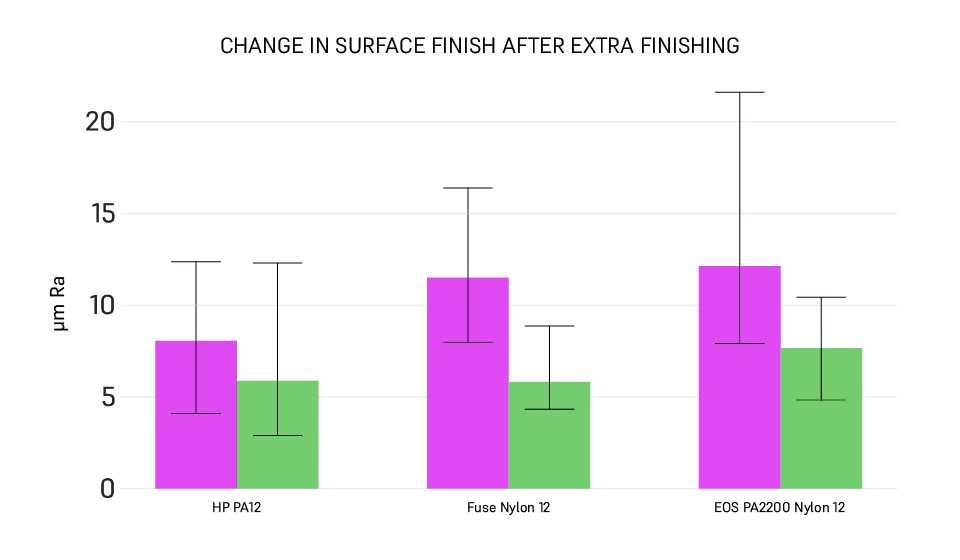
The main differentiator for surface finish is the degree or method of post-processing, rather than the chosen technology. With a ‘standard’ post-processing level — media blasting for powder bed fusion technologies and washing, then curing, with resin technology — the resin 3D printers presented the smoothest surface finish, while EOS SLS printers produced parts with the highest degree of surface roughness. Additional post-processing, such as tumbling or using the Fuse Blast Polishing System (Fuse Polish), significantly improved both SLS and MJF parts, with Fuse Polish taking parts to the smoothest finish shy of the SLA part. The table and graph below show the results of the test, where the lower the Ra is, the smoother the surface is.
| Printer | Fuse 1+ 30W | EOS P396 | HP Jet Fusion 5600 | Formlabs Form 4 |
|---|---|---|---|---|
| Technology | SLS | SLS | MJF | SLA |
| Material(s) | Nylon 12 | PA2200 - PA12 | HP 3D HR PA12 | Tough 2000 V2 |
| Post-Processing | Standard: Fuse Blast Fuse Polish |
Standard Tumbled |
Tumbled HR PA12 | Standard |
| Best Surface Finish Part | Nylon 12 with Fuse Polish | Tumbled PA2200 | HR PA12 Standard | – |
| Worst Surface Finish Part | Nylon 12 Standard | PA2200 Standard | HR PA12 Standard | – |
| Lowest Surface Roughness | 4.3 µm | 4.8 µm | 2.7 µm | 0.5 µm |
| Average Ra of Best Part | 5.8 µm | 7.6 µm | 6.0 µm | 4.3 µm |
| Average Ra of Worst Part | 11.5 µm | 12.1 µm | 8.9 µm | – |

Book a Consultation
Get in touch with our 3D printing experts for a 1:1 consultation to find the right solution for your business, receive ROI analyses, test prints, and more.
Test Methods and Products
Measuring Methods for Surface Finish
A visual appraisal of the surface finish of 3D printed parts can often be enough to determine if they meet the standards of your intended use. However, data measuring surface roughness can be extremely helpful in determining the average performance of a particular technology across multiple prints and printers.
Surface finish and surface roughness are often used interchangeably. For parts produced by powder bed technology, especially, surface roughness is the main way of determining a technology’s ability to produce a ‘high-quality’ surface finish.
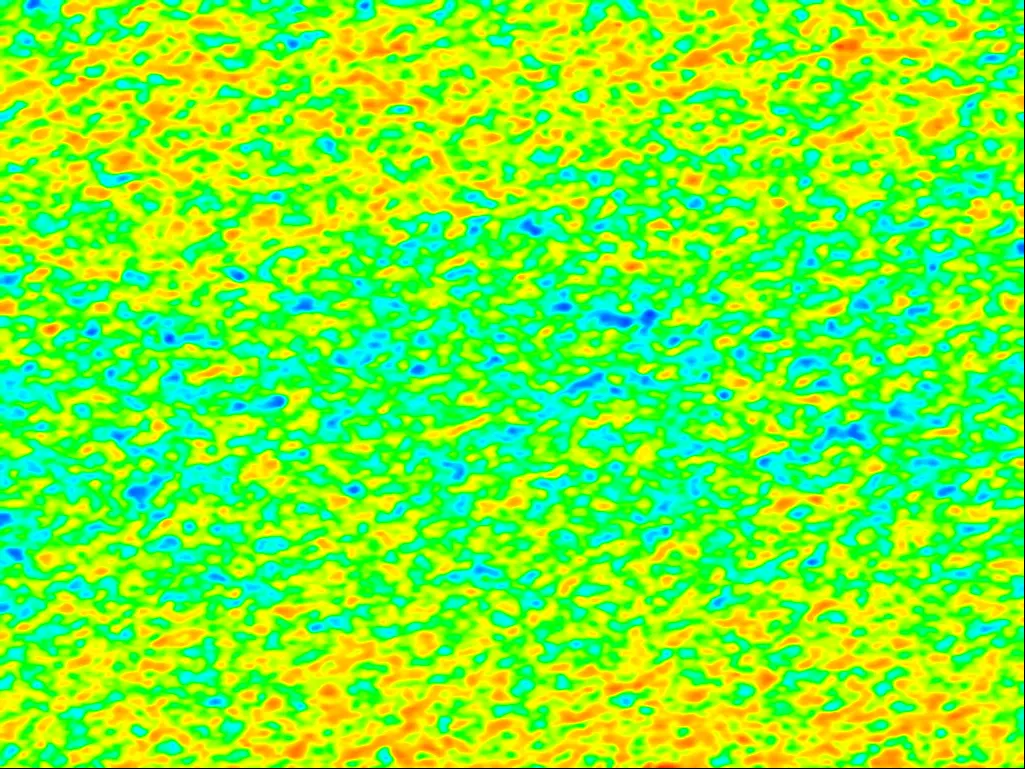
The most common method for measuring the roughness of a surface is via a surface profilometer (also referred to as a contact profilometer). This method uses a probe held against a surface and pulled in a straight line, creating a profile of the surface as the probe moves up and down.
The measurements taken by the probe are then plotted to find Ra and Rz.
- Ra is the measurement of the average deviation of the surface along that line.
- Rz is a measurement of the greatest difference between a peak (high point on the line) and a trough (low point on the line).
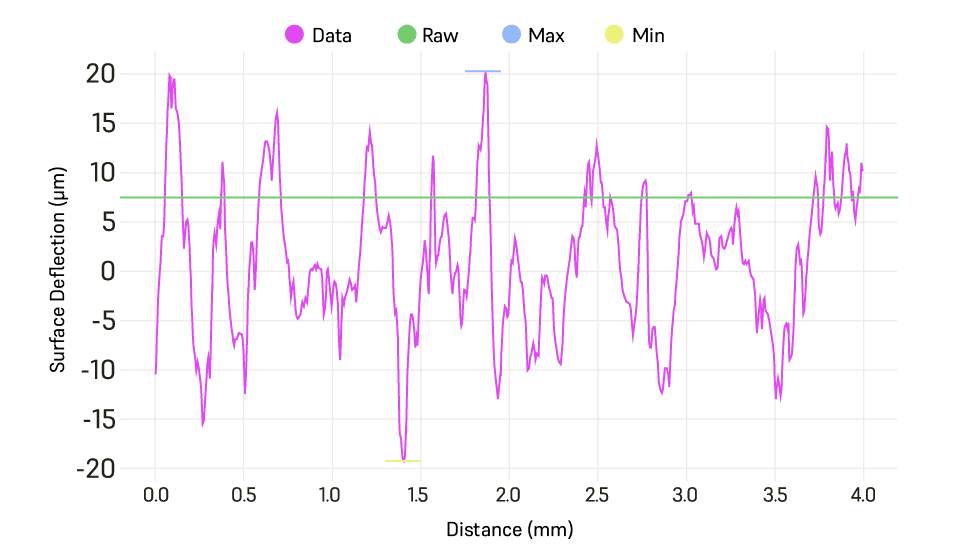
This deviation plot from a surface profilometer shows the deflection of the probe as it is drawn across a surface. Here, Ra is 7.5 µm, calculated as the root mean square of the curve. Rz is 39 (the greatest difference between the peak of 20 and the trough of -19).
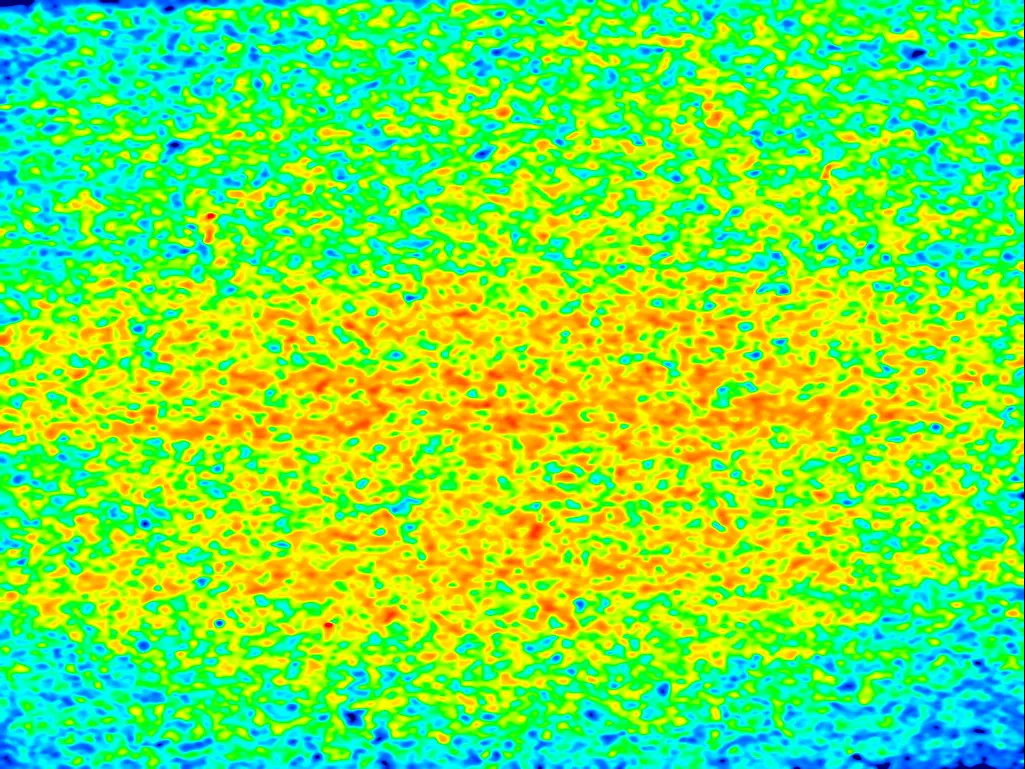
Three other methods of determining surface roughness were employed: optical profilometry, high-contrast photography, and SEM microscopy. Though the major results of this paper are taken from the surface profilometer readings, these supplementary measurements are included in the Detailed Results, and can provide further context and evidence.

From left to right: An optical profilometry scan via a Keyence VR-3000, which provides surface plots and Sa/Sz; high contrast photography, which shows the roughness along a surface; and SEM microscopy taken with a Phenom XL, which shows the microscale deviations in the surface. Additionally, gloss measurements are used to show how shiny a part appears to be, which is often compared with the surface roughness. Since these analysis techniques can get extremely complicated, they aren’t described in detail here, but are described by the various manufacturers in the related links.
Choosing the 3D Printers: Fuse Series vs. EOS vs. HP vs. Form 4
The four printers chosen for this study are those most commonly used for industrial or end-use applications, rather than fast prototyping or on-demand jigs and fixtures for the factory floor.
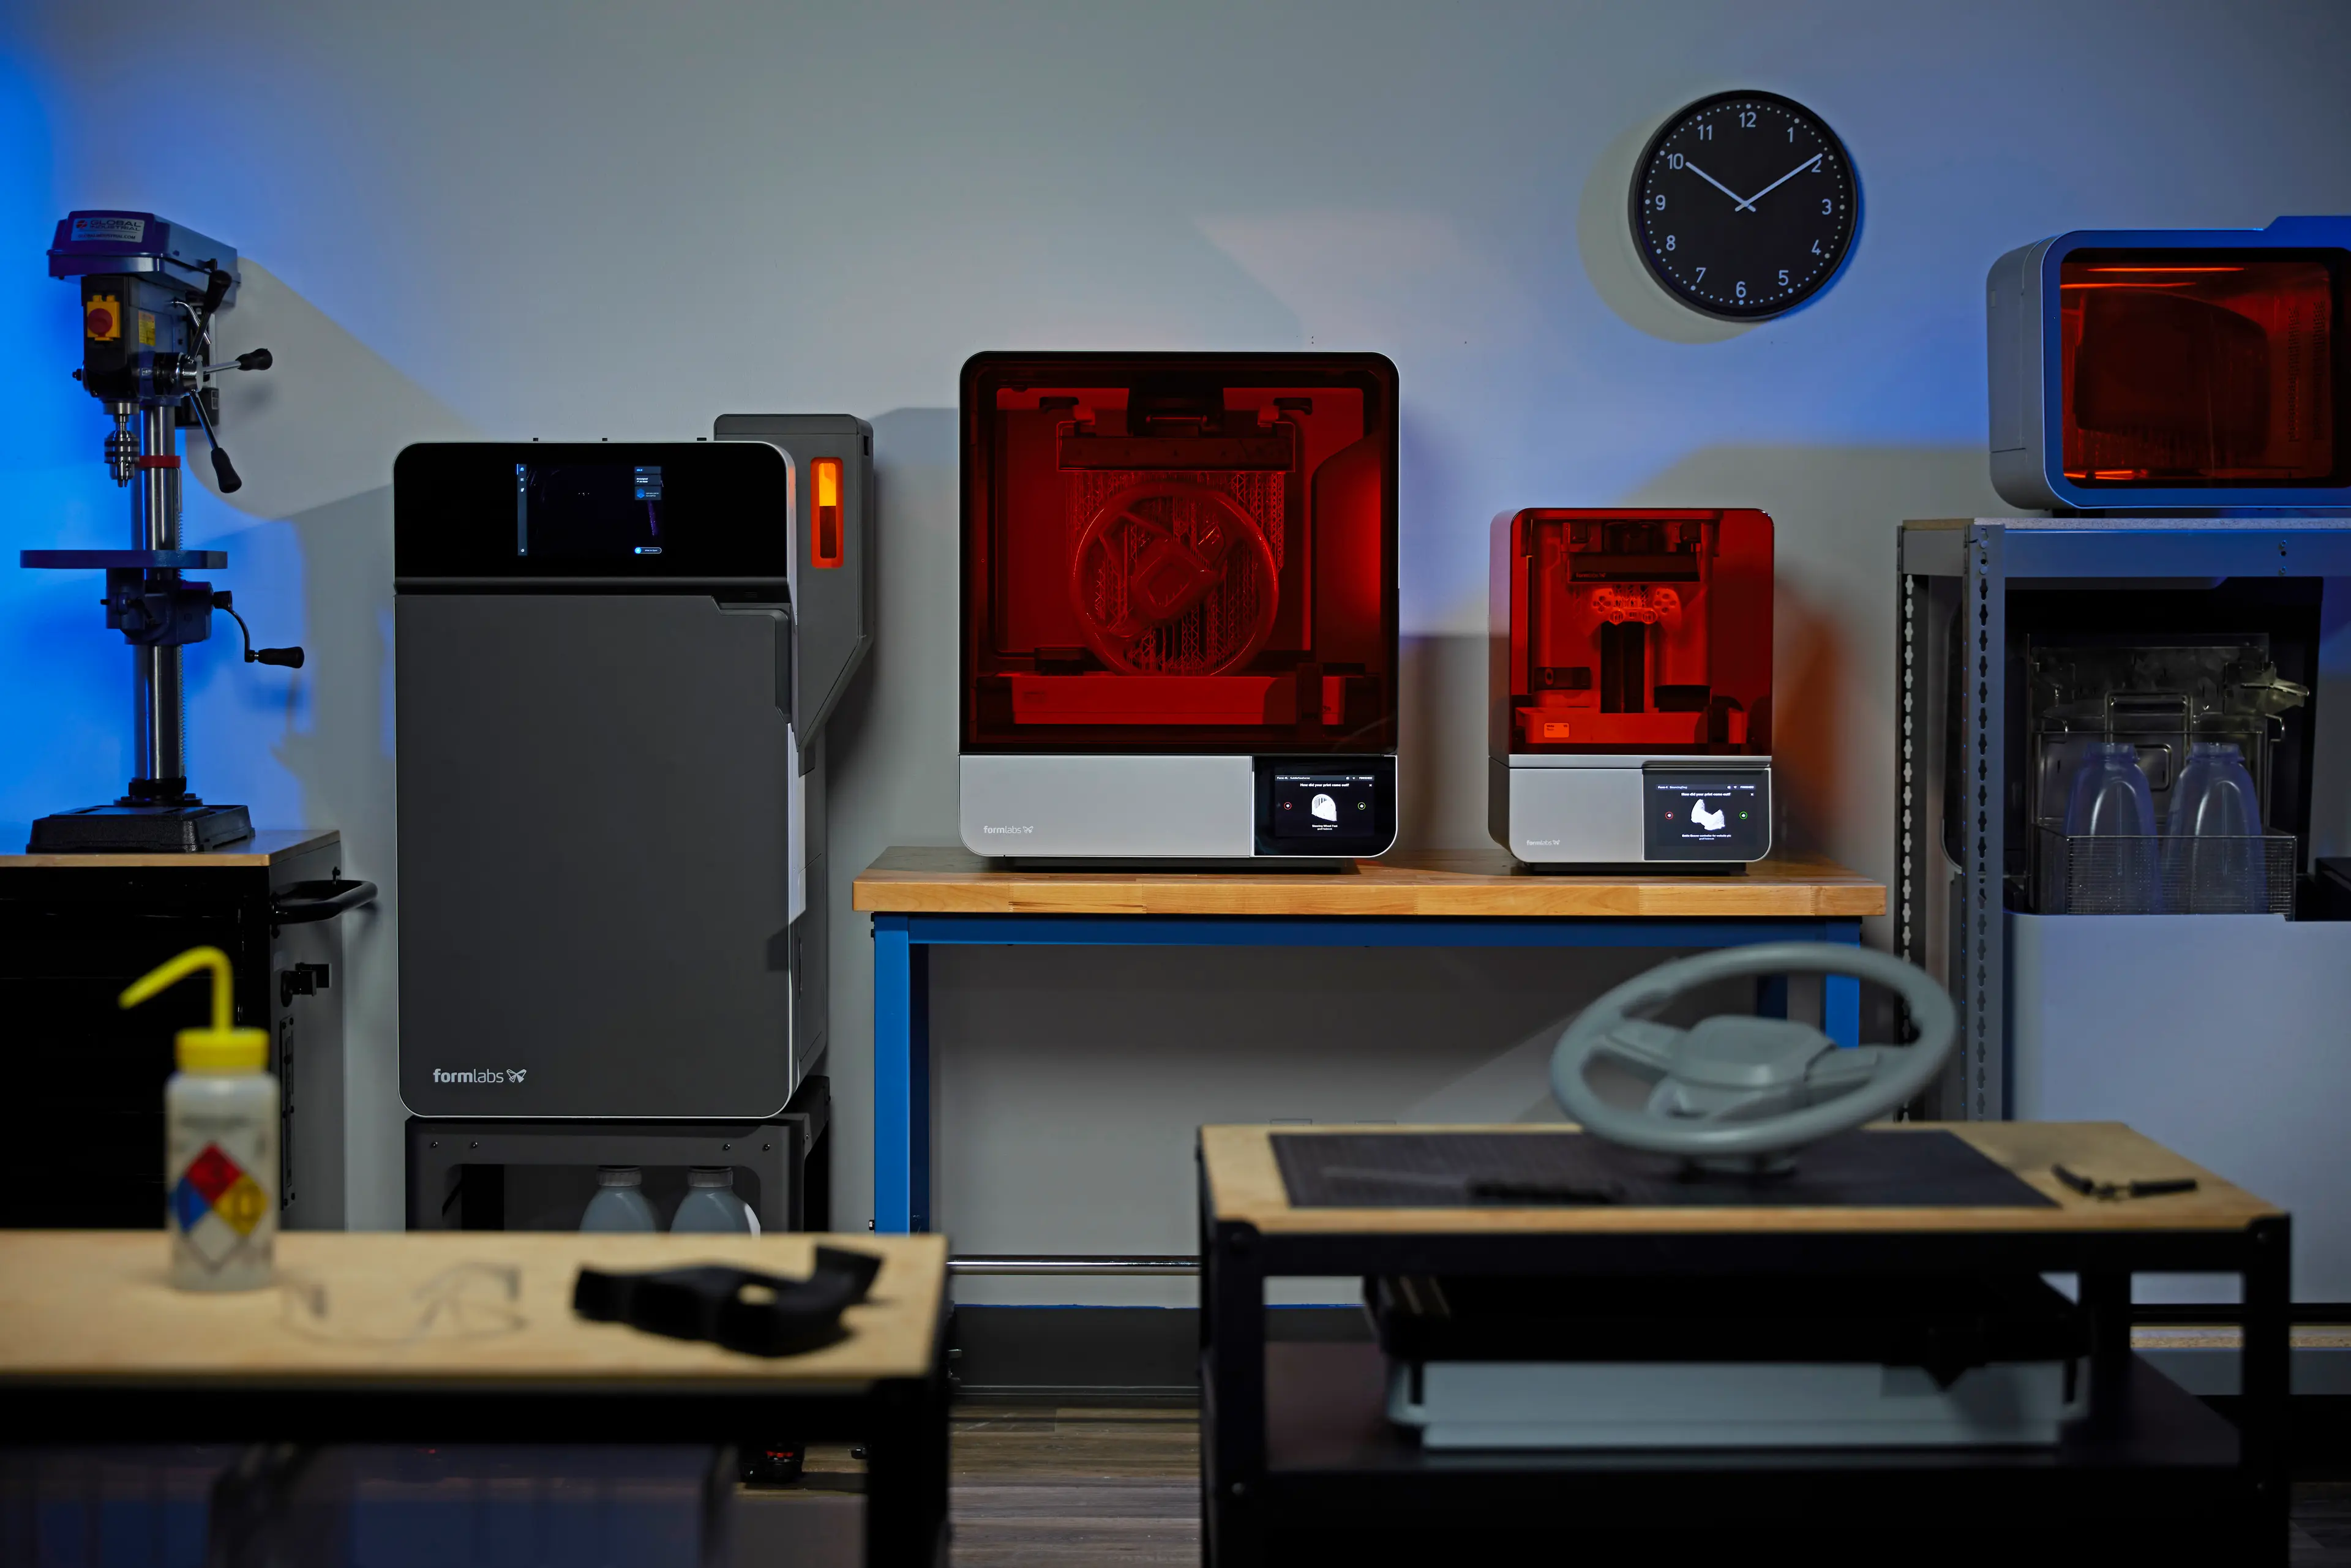
The Fuse 1+ 30W printer is the most widely used powder bed technology printer available, accounting for more than half of all powder bed printers sold globally. It is the most accessible industrial option, with a complete ecosystem costing about $50,000 and a small footprint of about 100 sq feet (10 sq meters). The next two most commonly used powder bed fusion 3D printers are the HP MJF Series and the EOS SLS printers. Both of these options typically cost between $200,000 and $500,000, require extensive infrastructure, and occupy a large footprint.
MJF technology uses a fusing agent and radiative heat to fuse powder particles together, while SLS technology uses a high-powered laser to melt and fuse the powder particles together. MJF technology is patented by Hewlett-Packard (HP), while several companies offer SLS 3D printers, including Formlabs and EOS.
The fourth printer in this study is Formlabs’ Form 4 SLA desktop 3D printer. While a very different process from the three powder bed technology printers, Form 4 parts are also often used in end-use applications, and surface finish is seen as the closest to injection-molded plastics.
Since Formlabs isn’t an operator of the EOS and HP printers, these parts were ordered from respected service bureaus, printed on the respective machines, and post-processed according to instructions, then shipped back to Formlabs for analysis.
Choosing Materials and Post-Processing Options
For each of the four technologies we evaluated, we chose the materials most commonly used for end-use product applications. For each of the materials, after printing, each part was processed using a ‘standard’ and an ‘extra’ post-processing step. These steps are what is recommended by the manufacturers for finishing their materials.
For Fuse Series Nylon 12 Powder:
For EOS P396 PA2200 Nylon 12:
-
Extra - Vibratory tumbling
For HP Jet Fusion PA12:
-
Extra - Vibratory tumbling
For Form 4 Tough 2000 Resin:
-
Extra - There is no additional post-processing recommended standard for SLA
Test Part and Test Surfaces
In order to compile representative data, the choice of the part was extremely important. Multiple factors influence the surface finish of a 3D printed part, including:
-
Orientation
-
Supports
-
Curved features/stepping
-
Specific geometries (e.g., very thin walls or pins)
-
Post-processing methods
-
Print defects
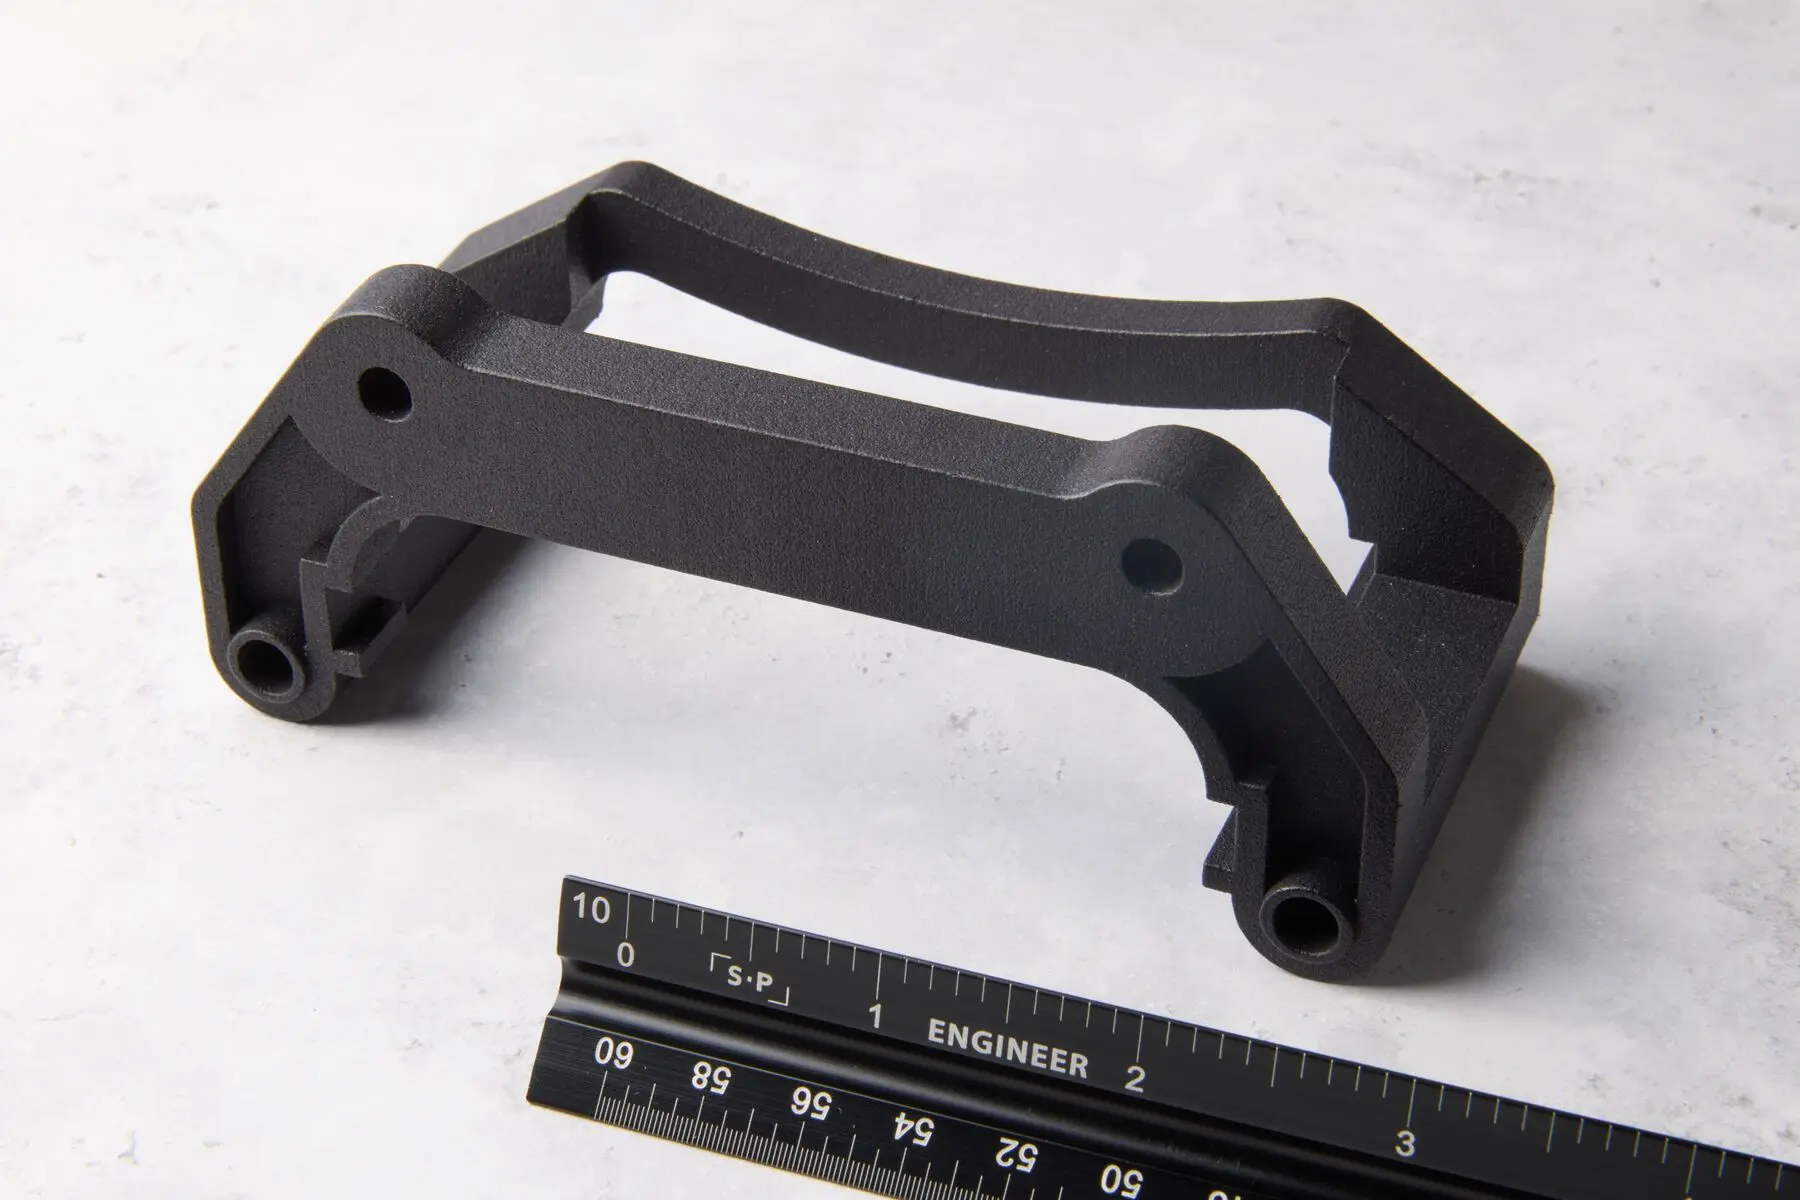
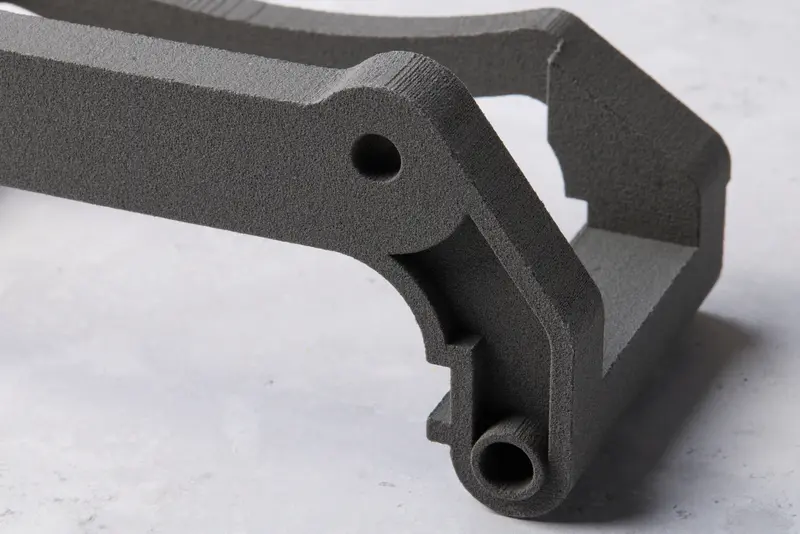
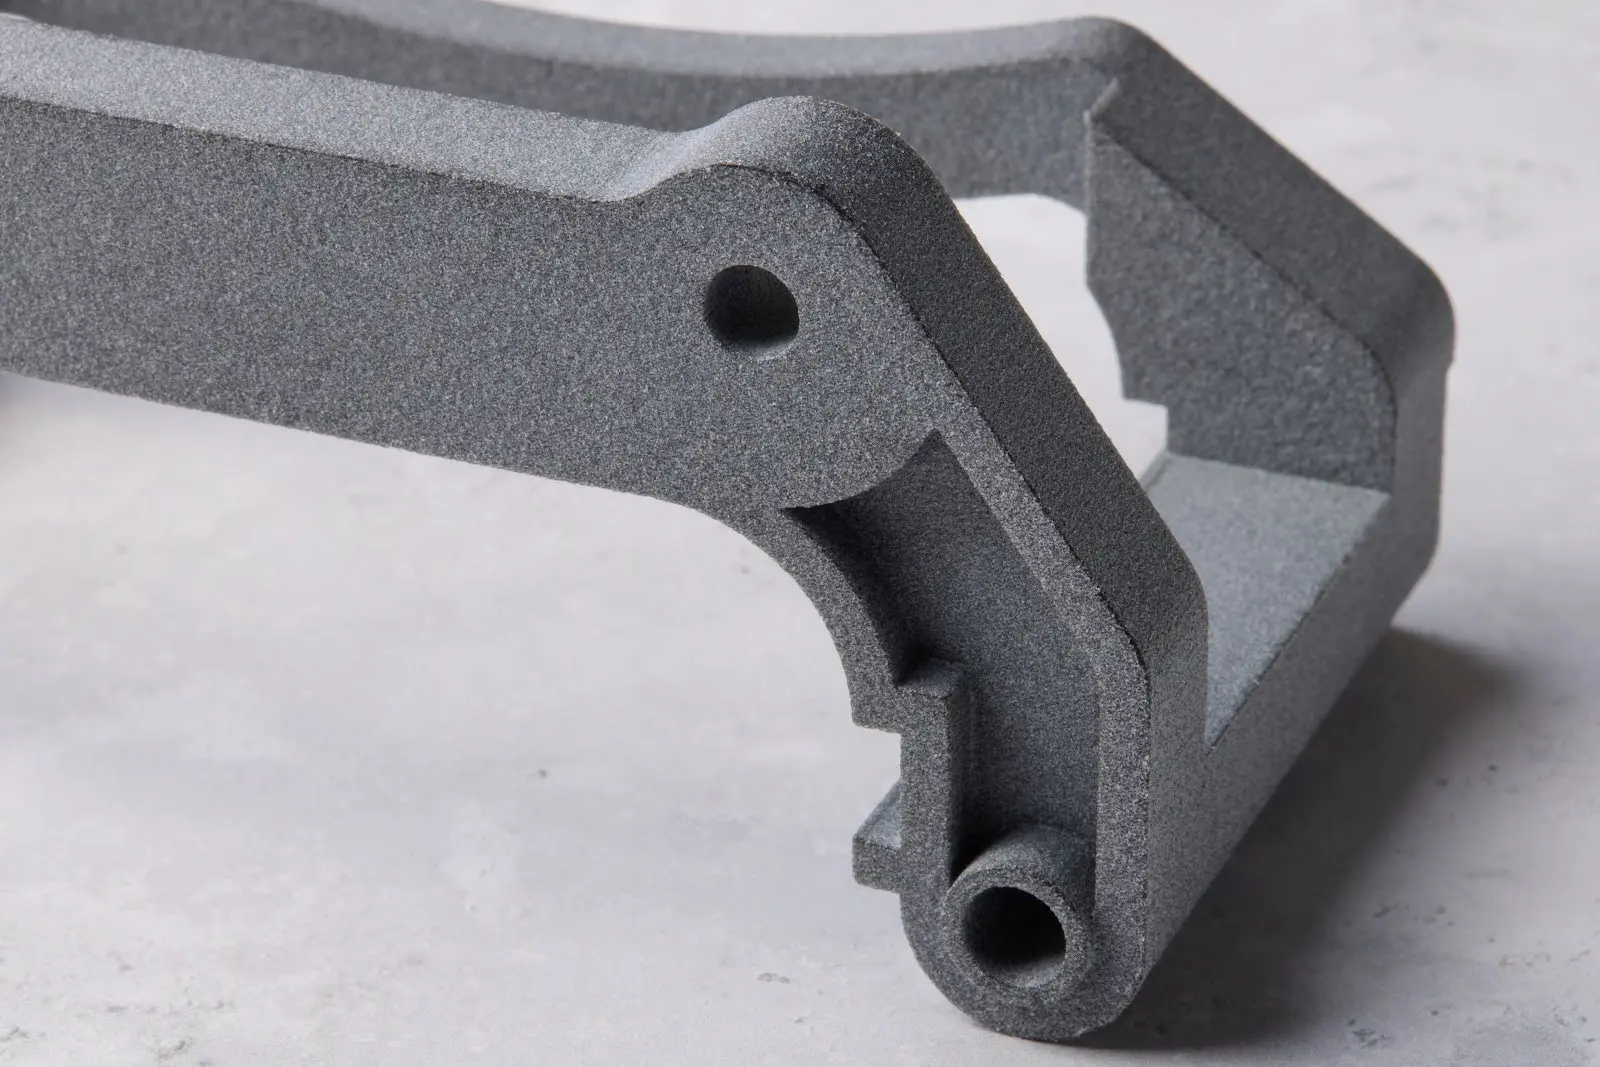
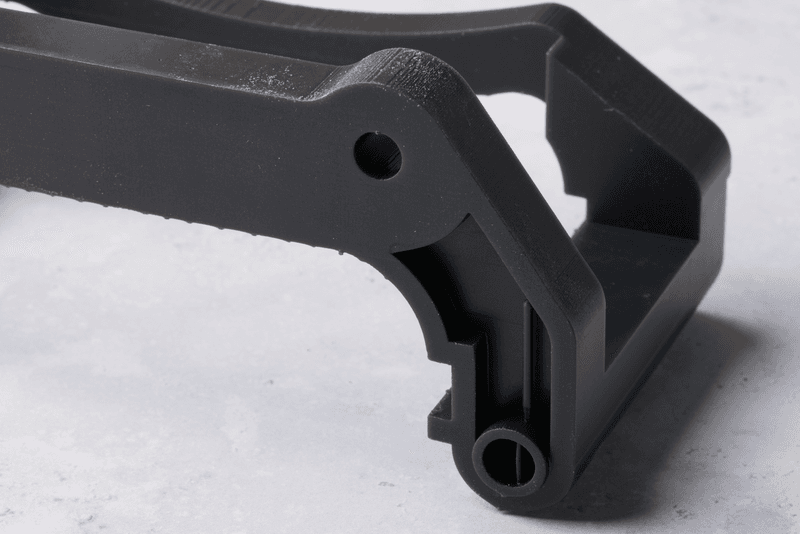
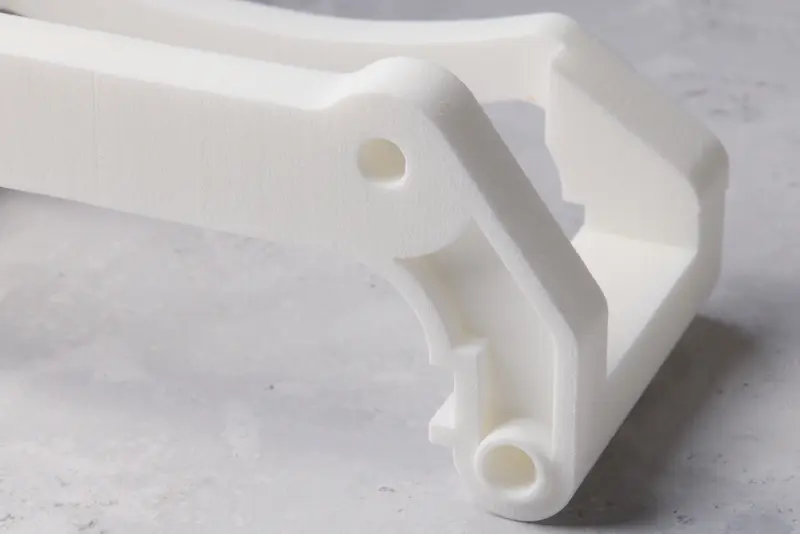
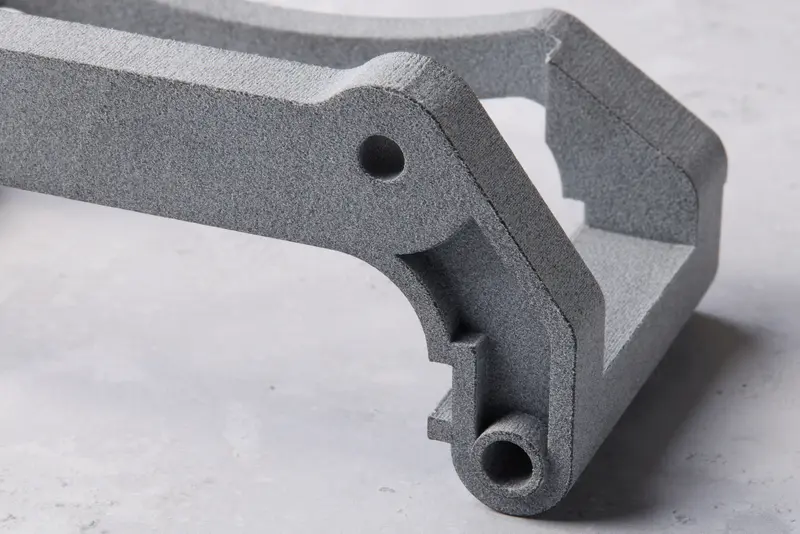
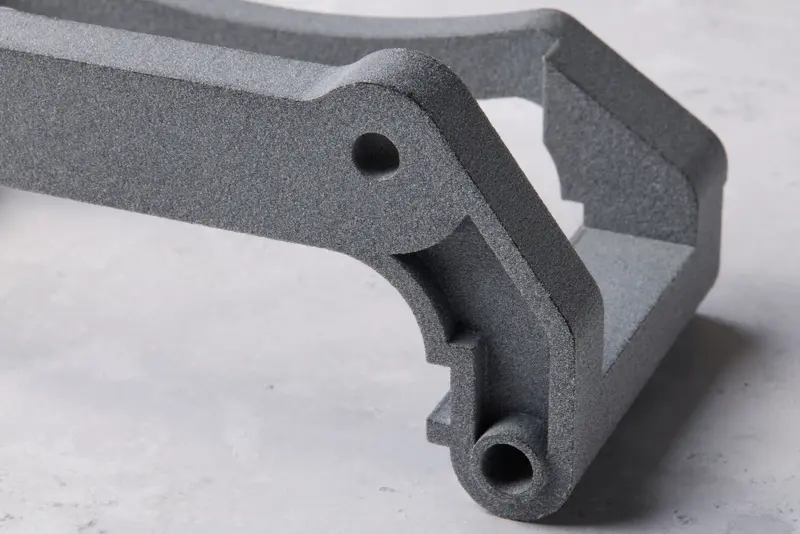
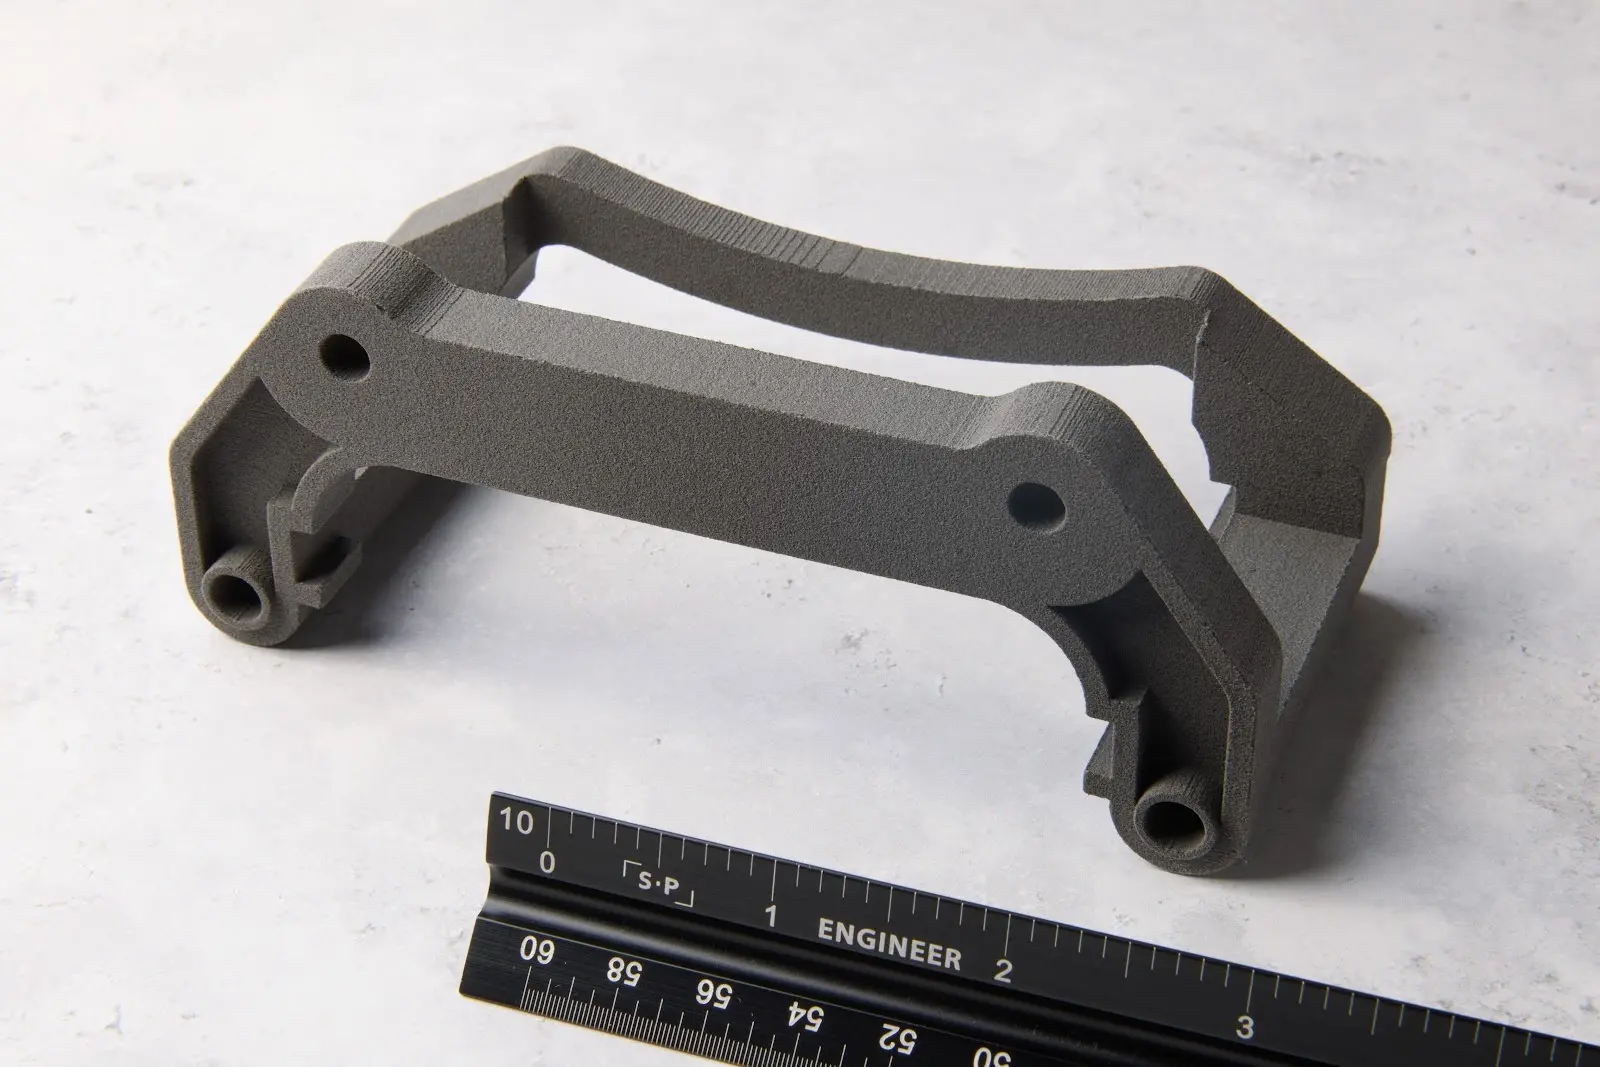
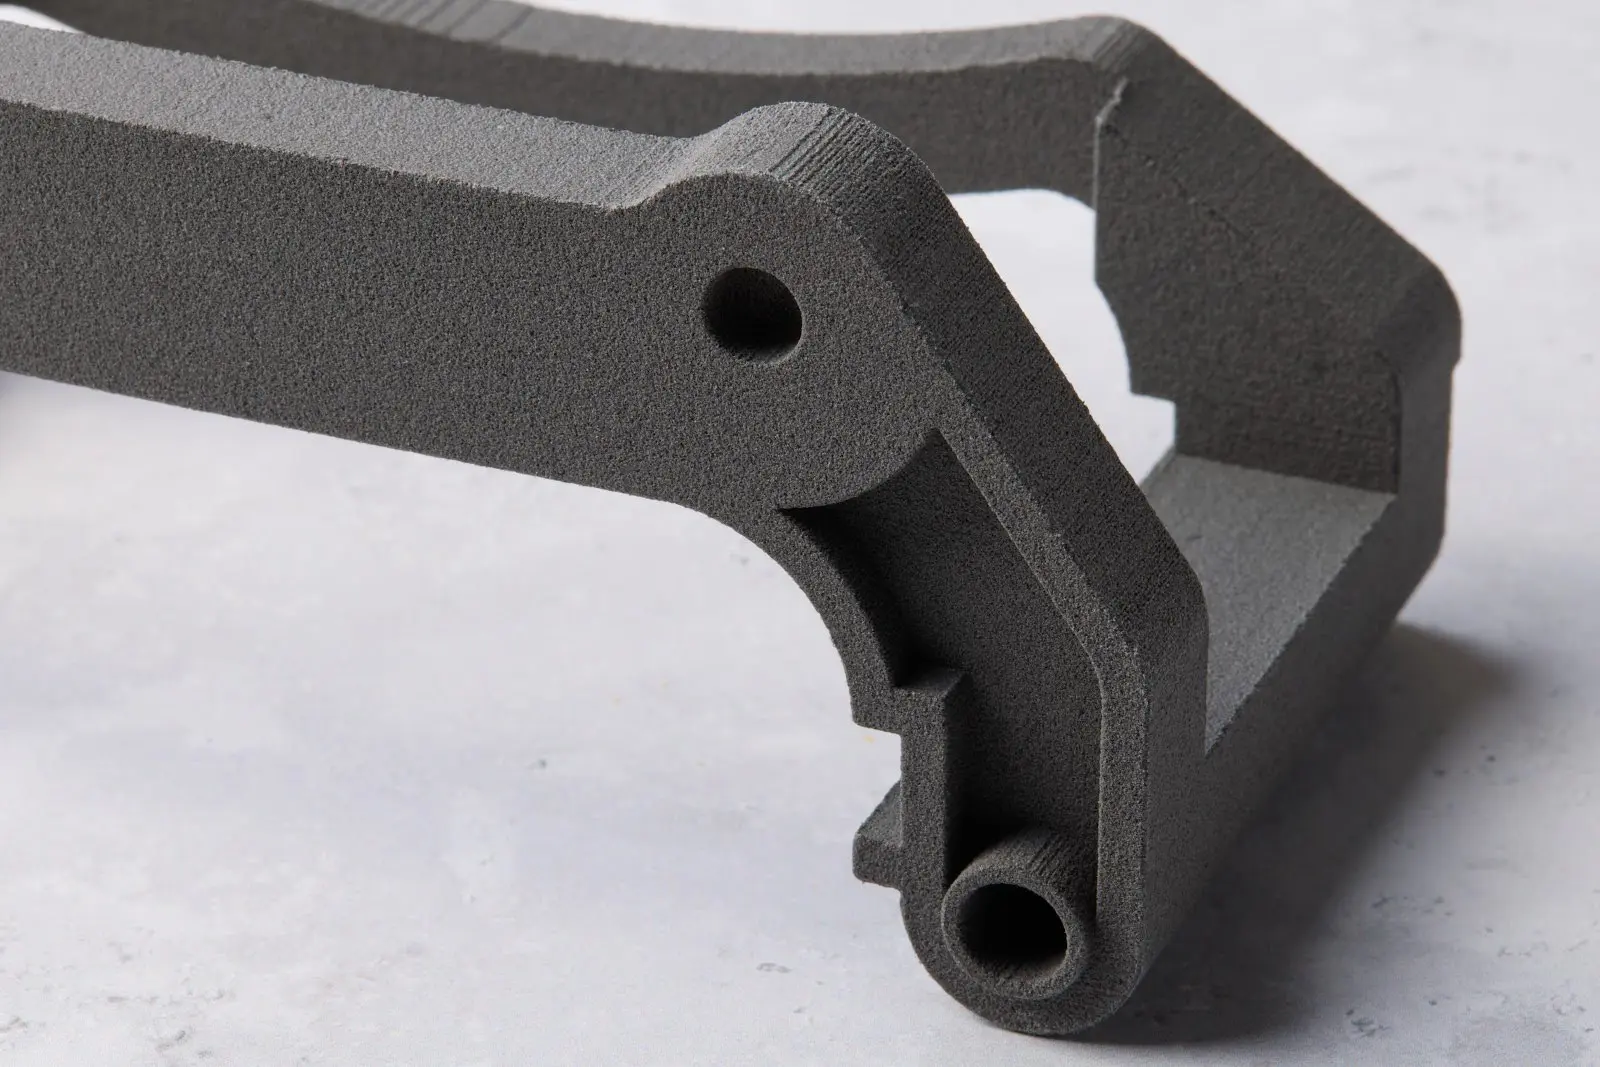
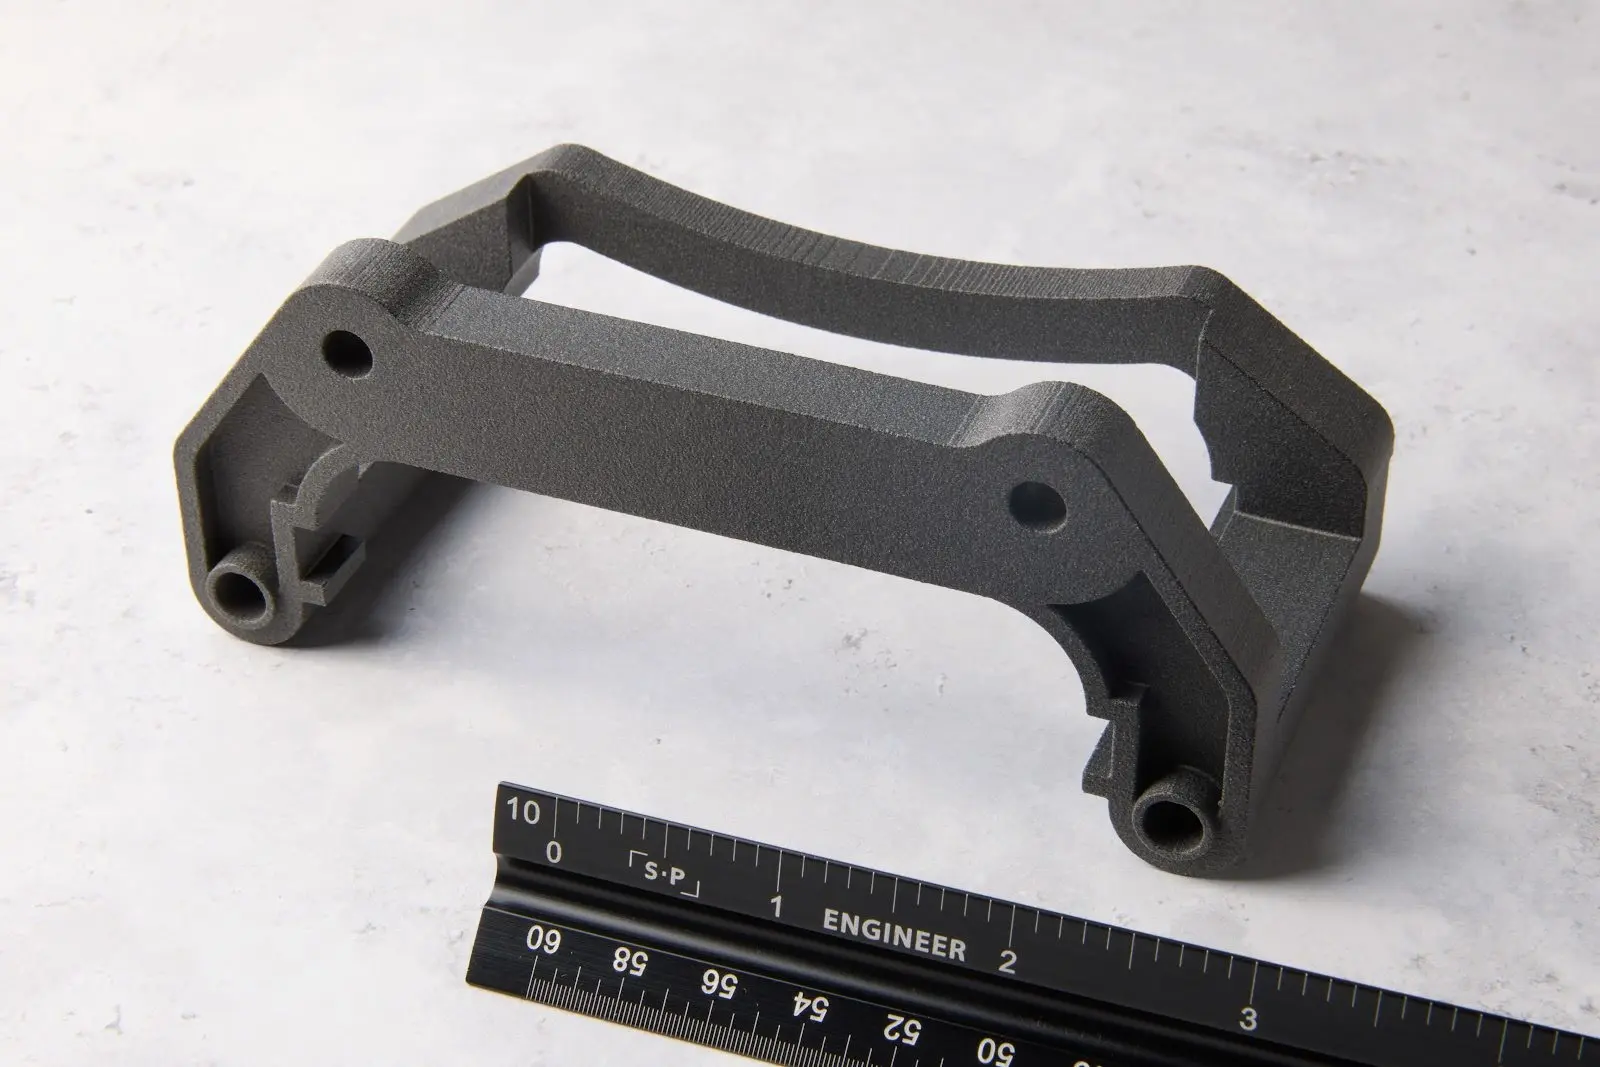
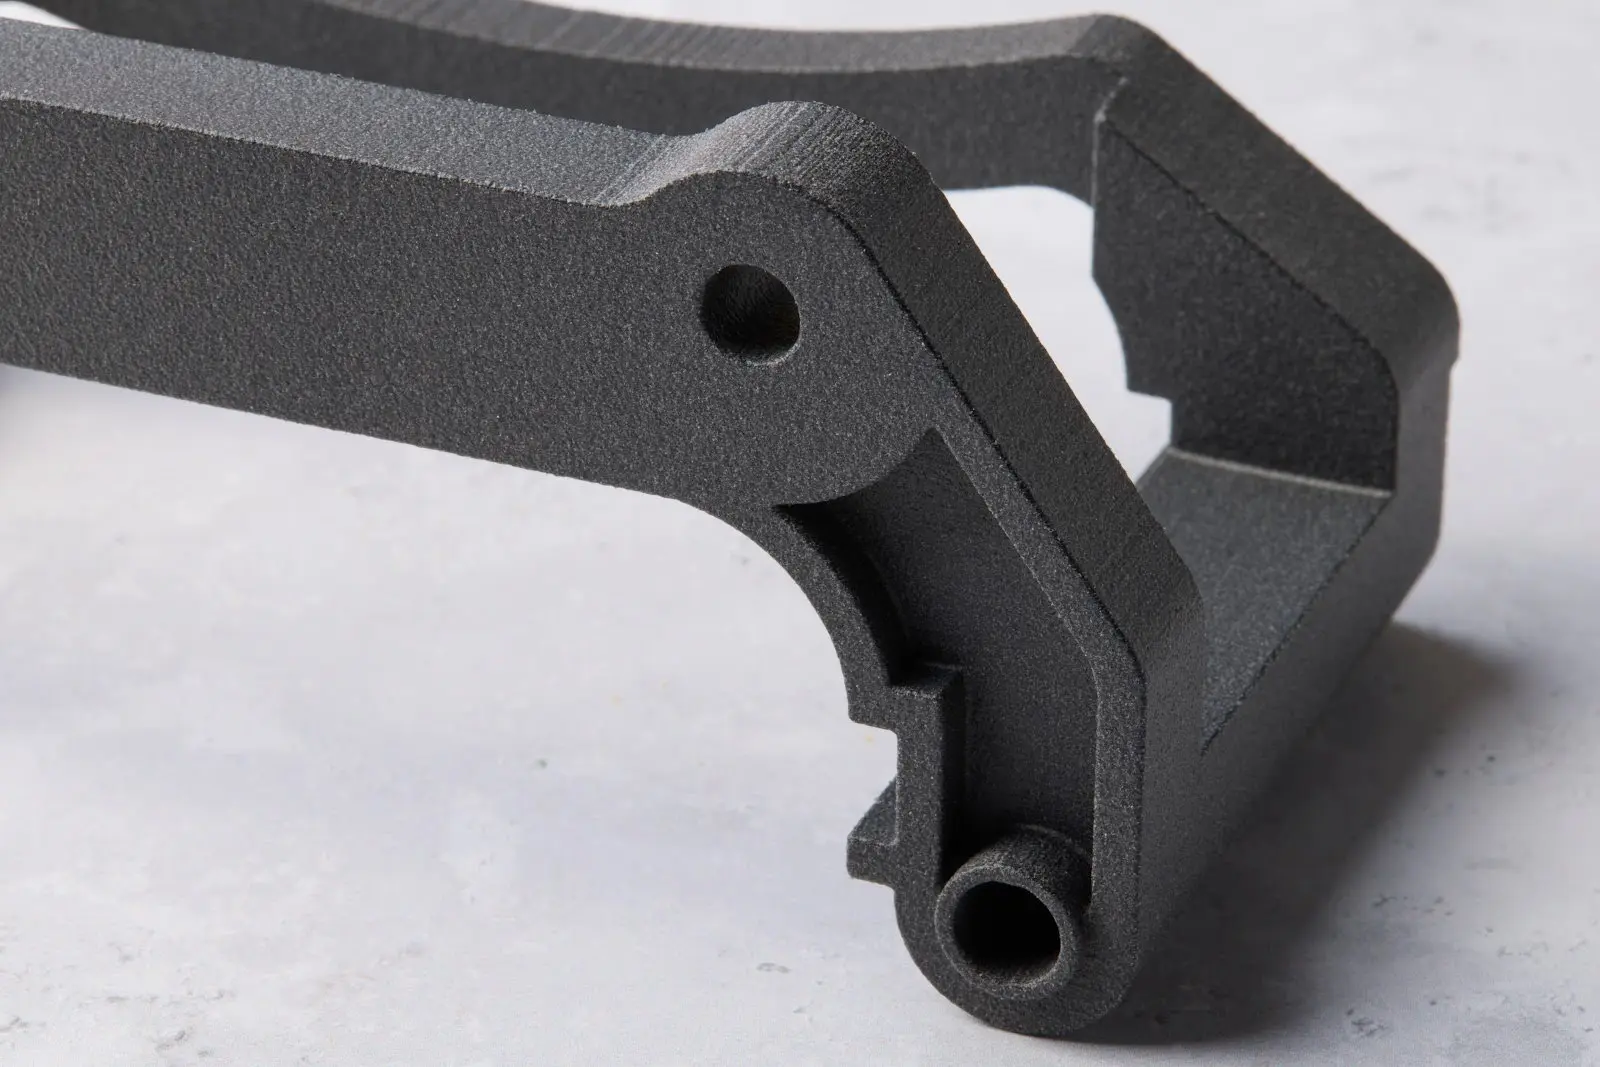
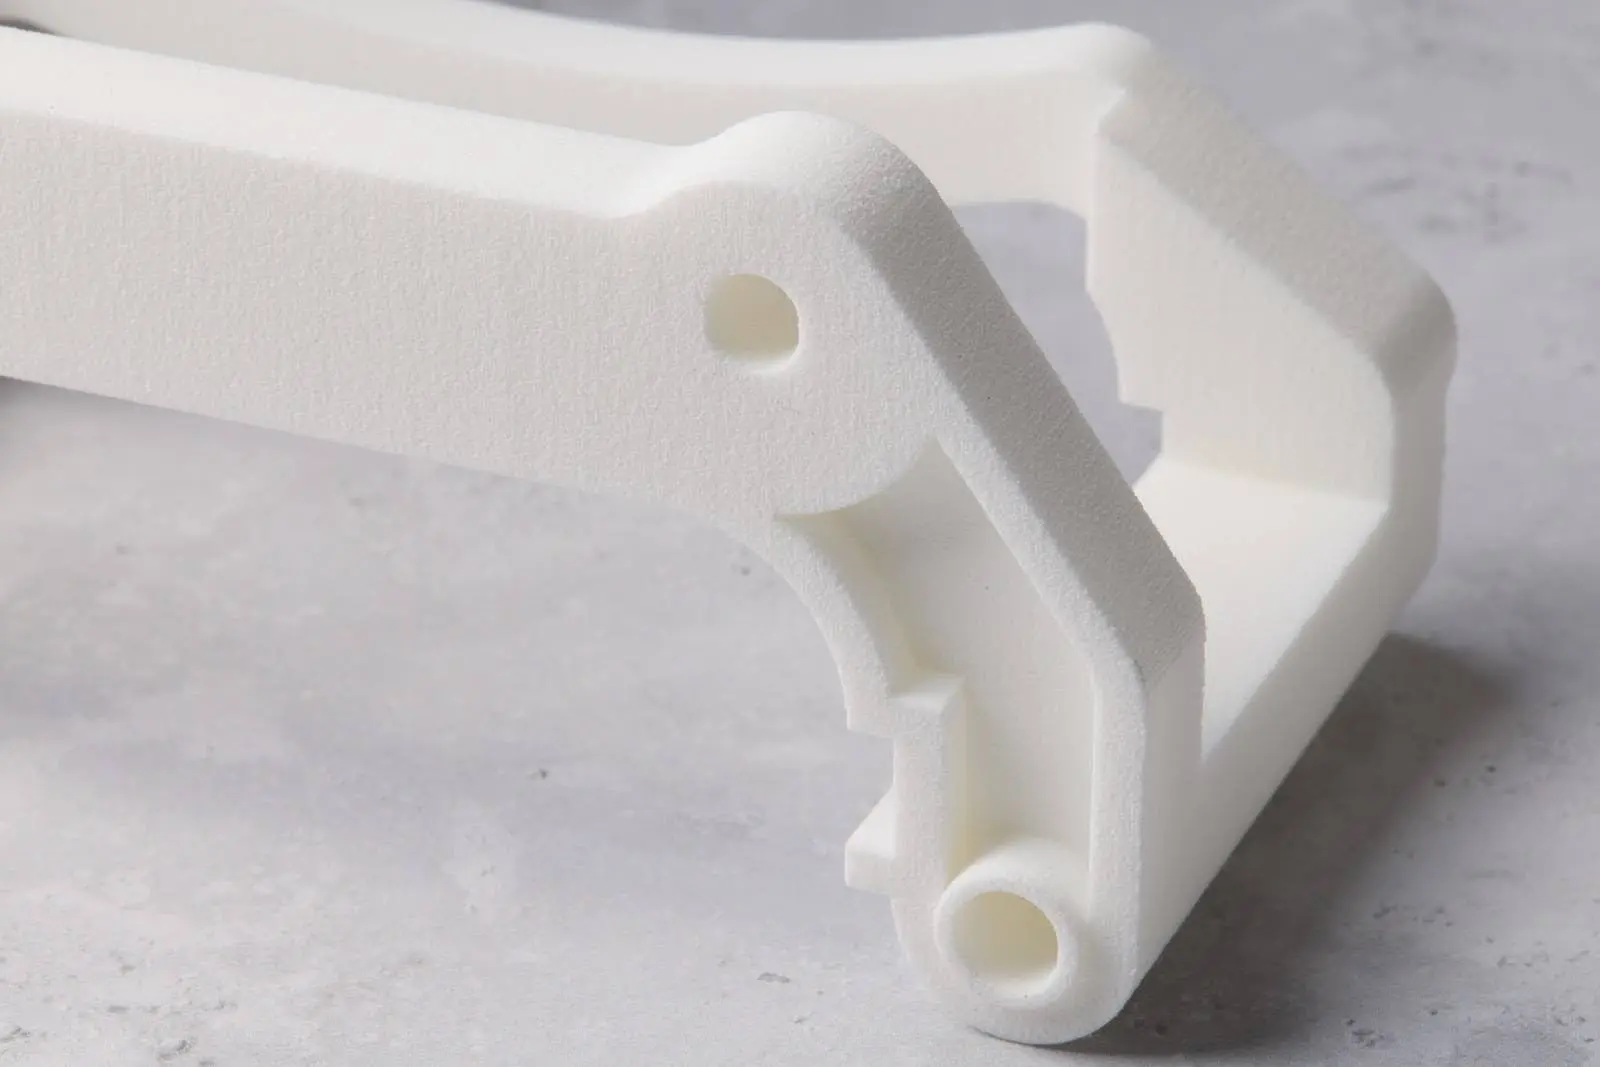
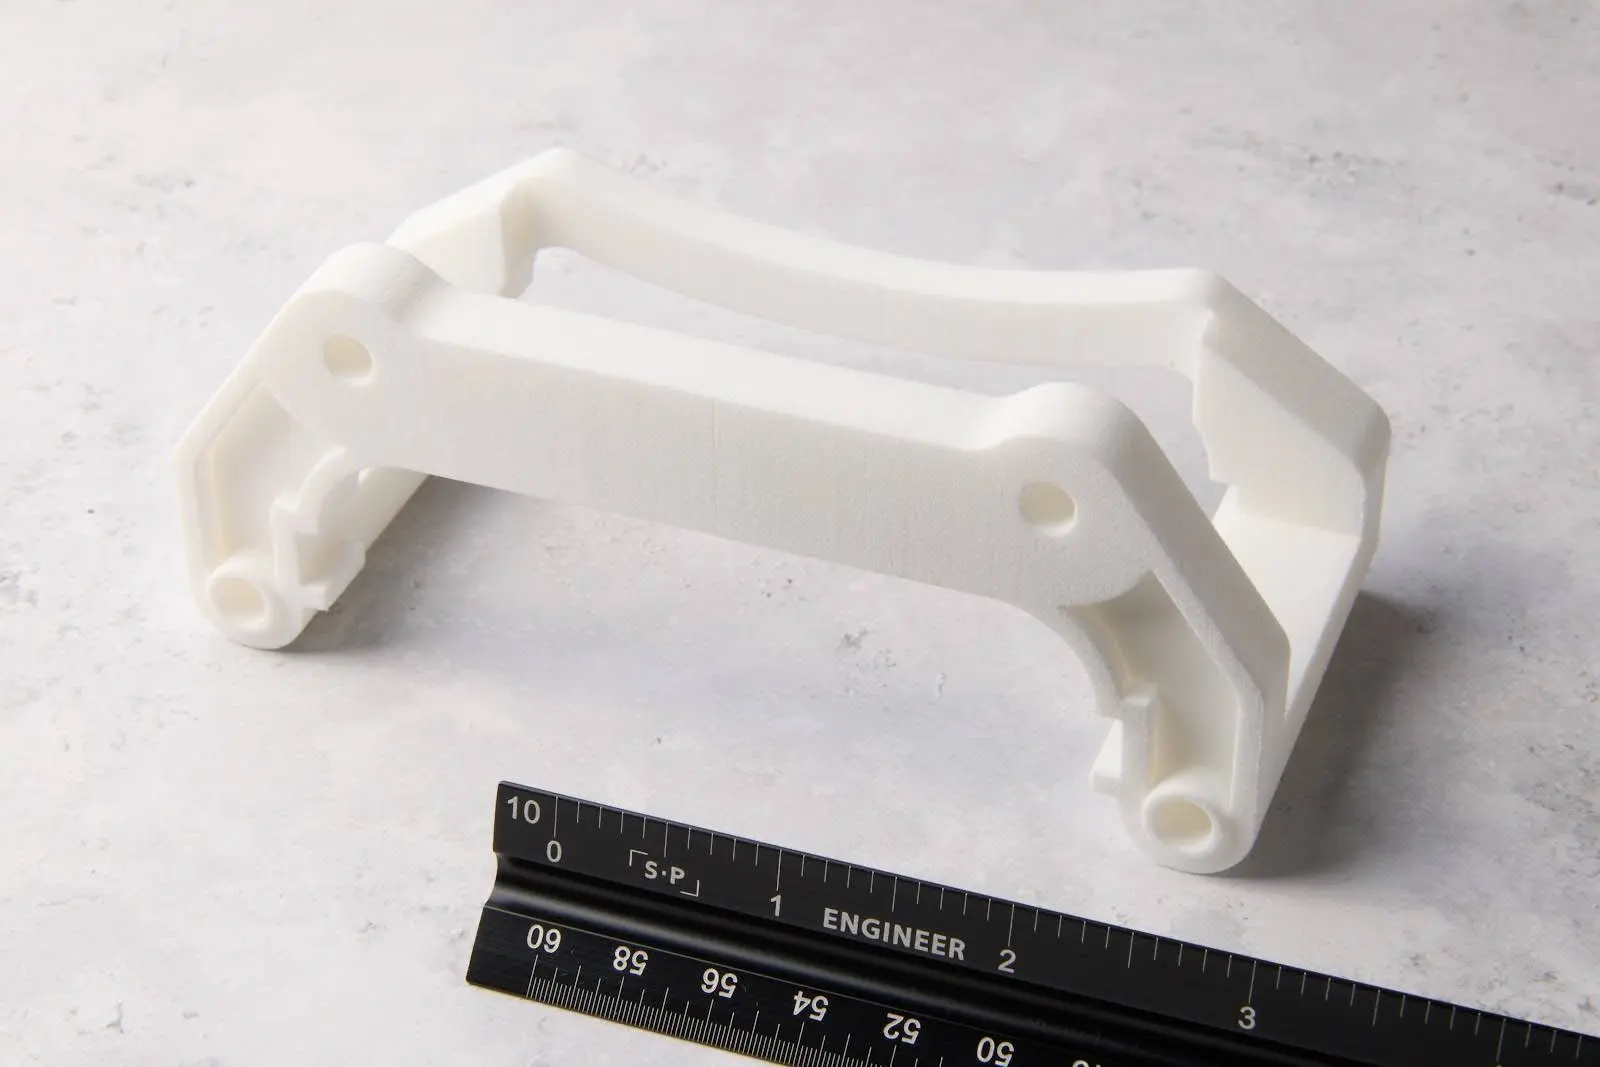
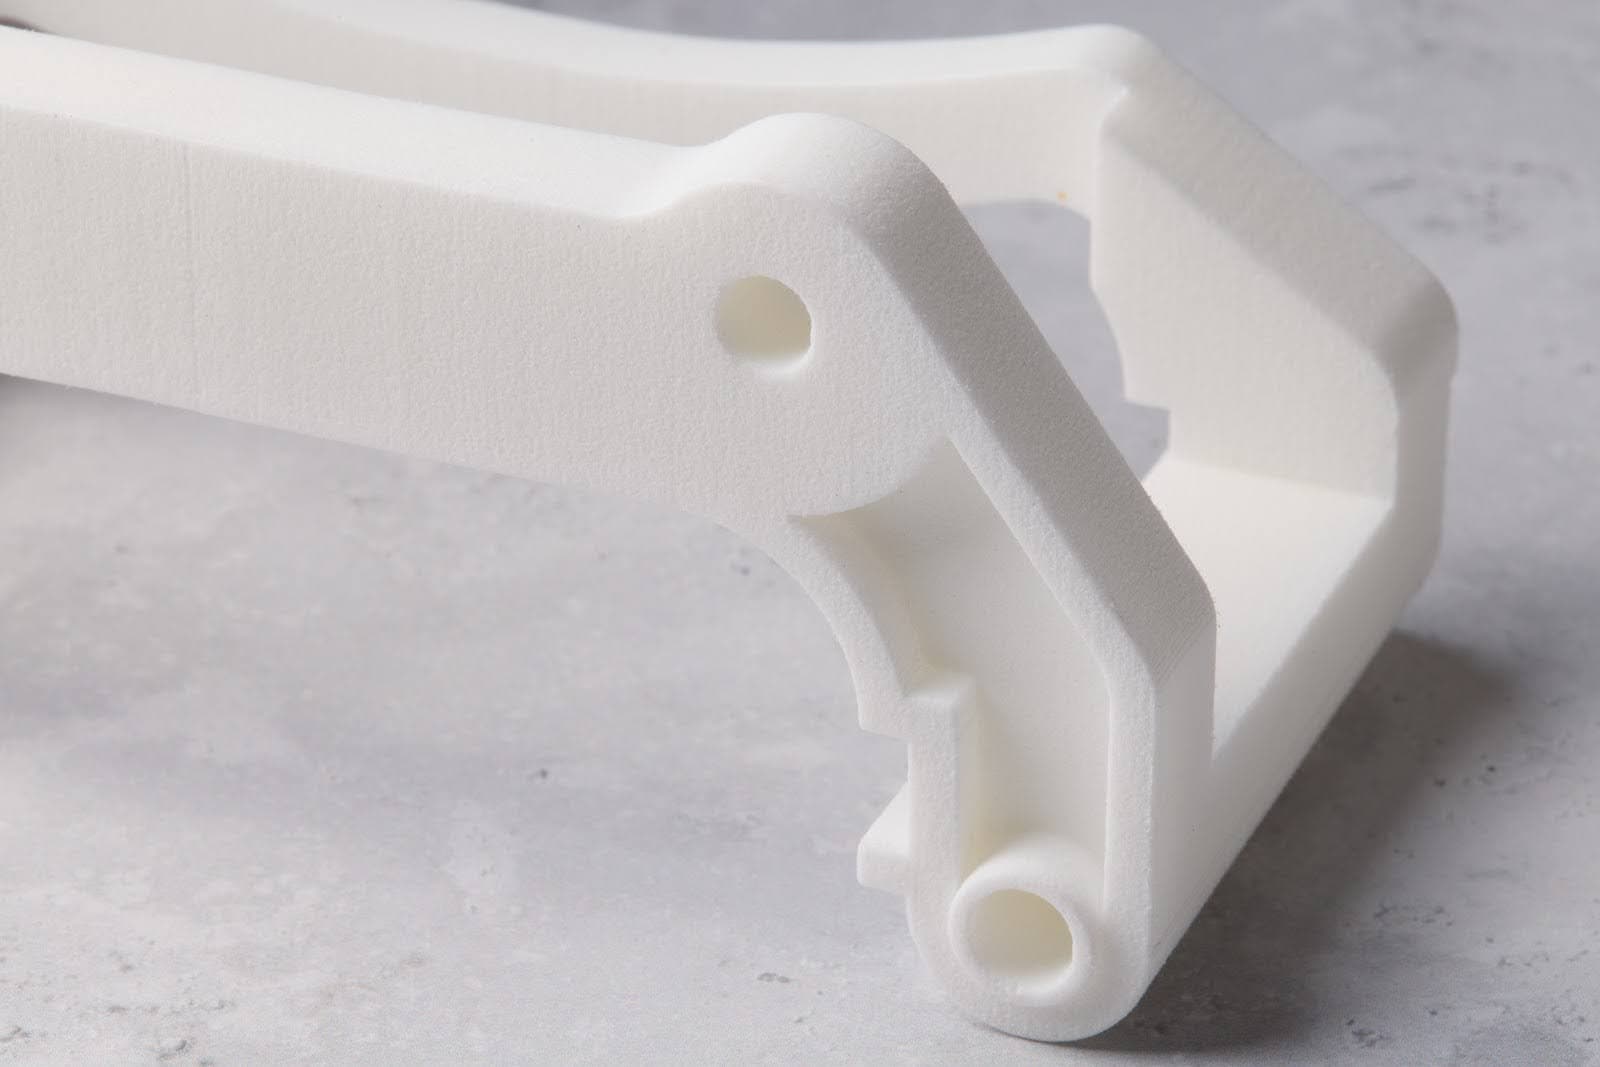
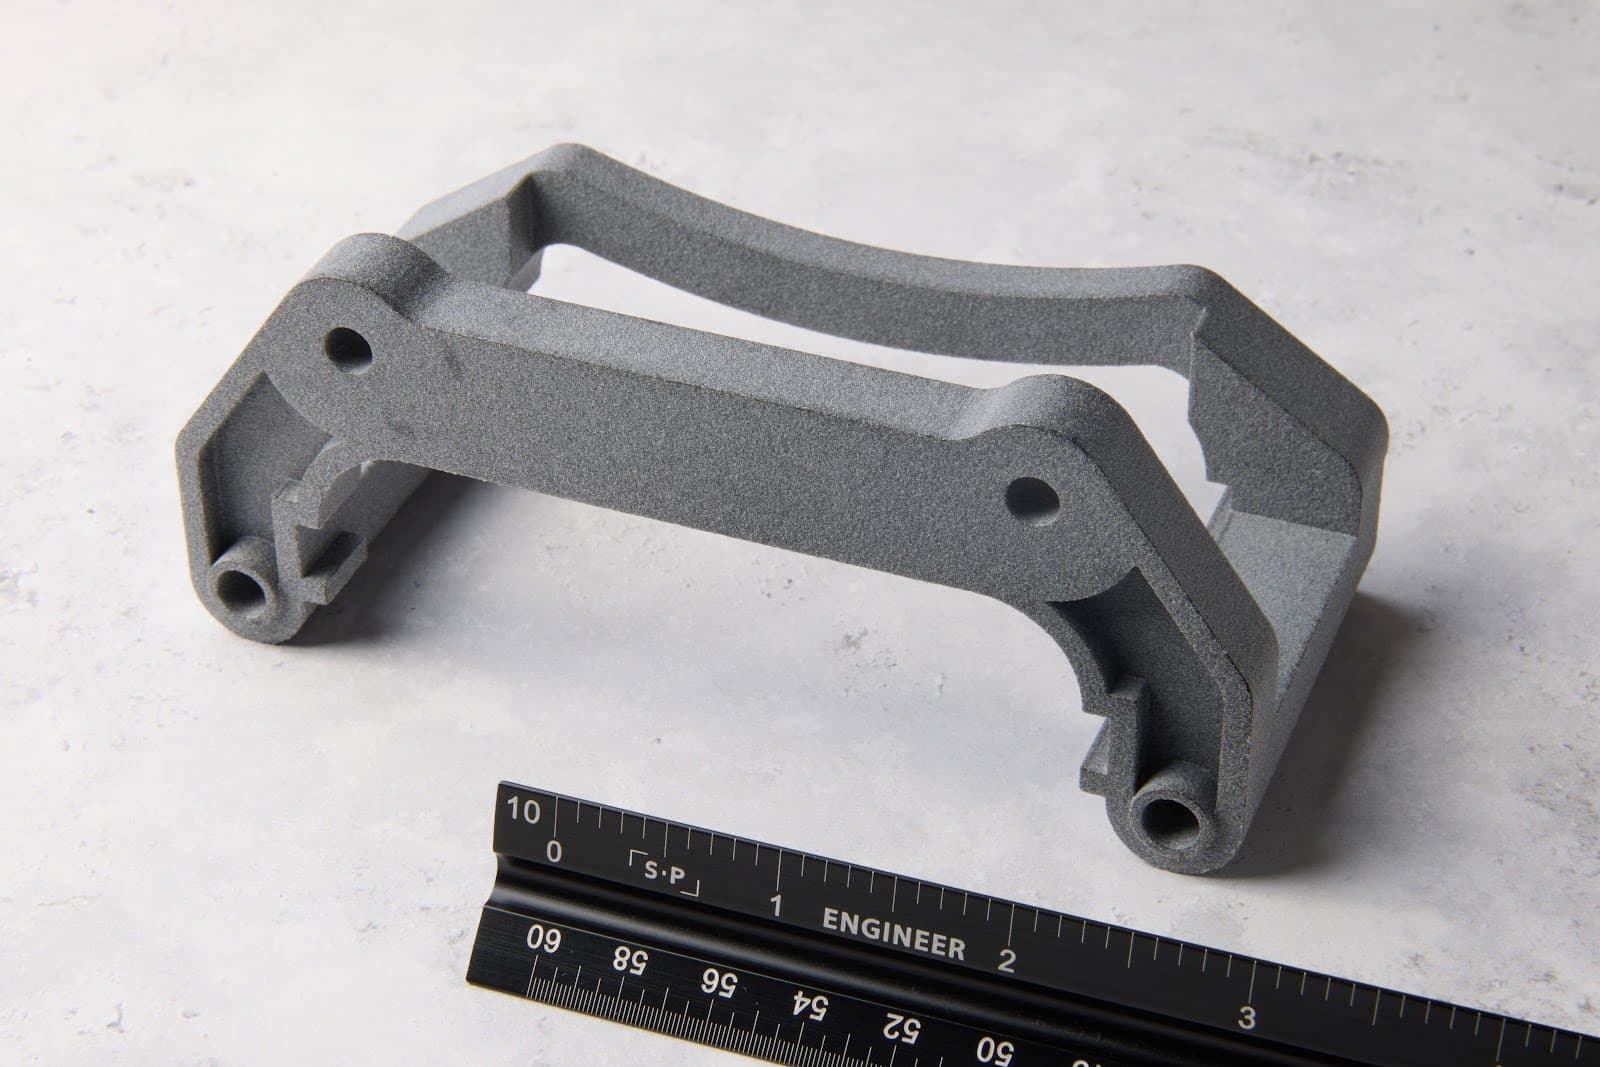
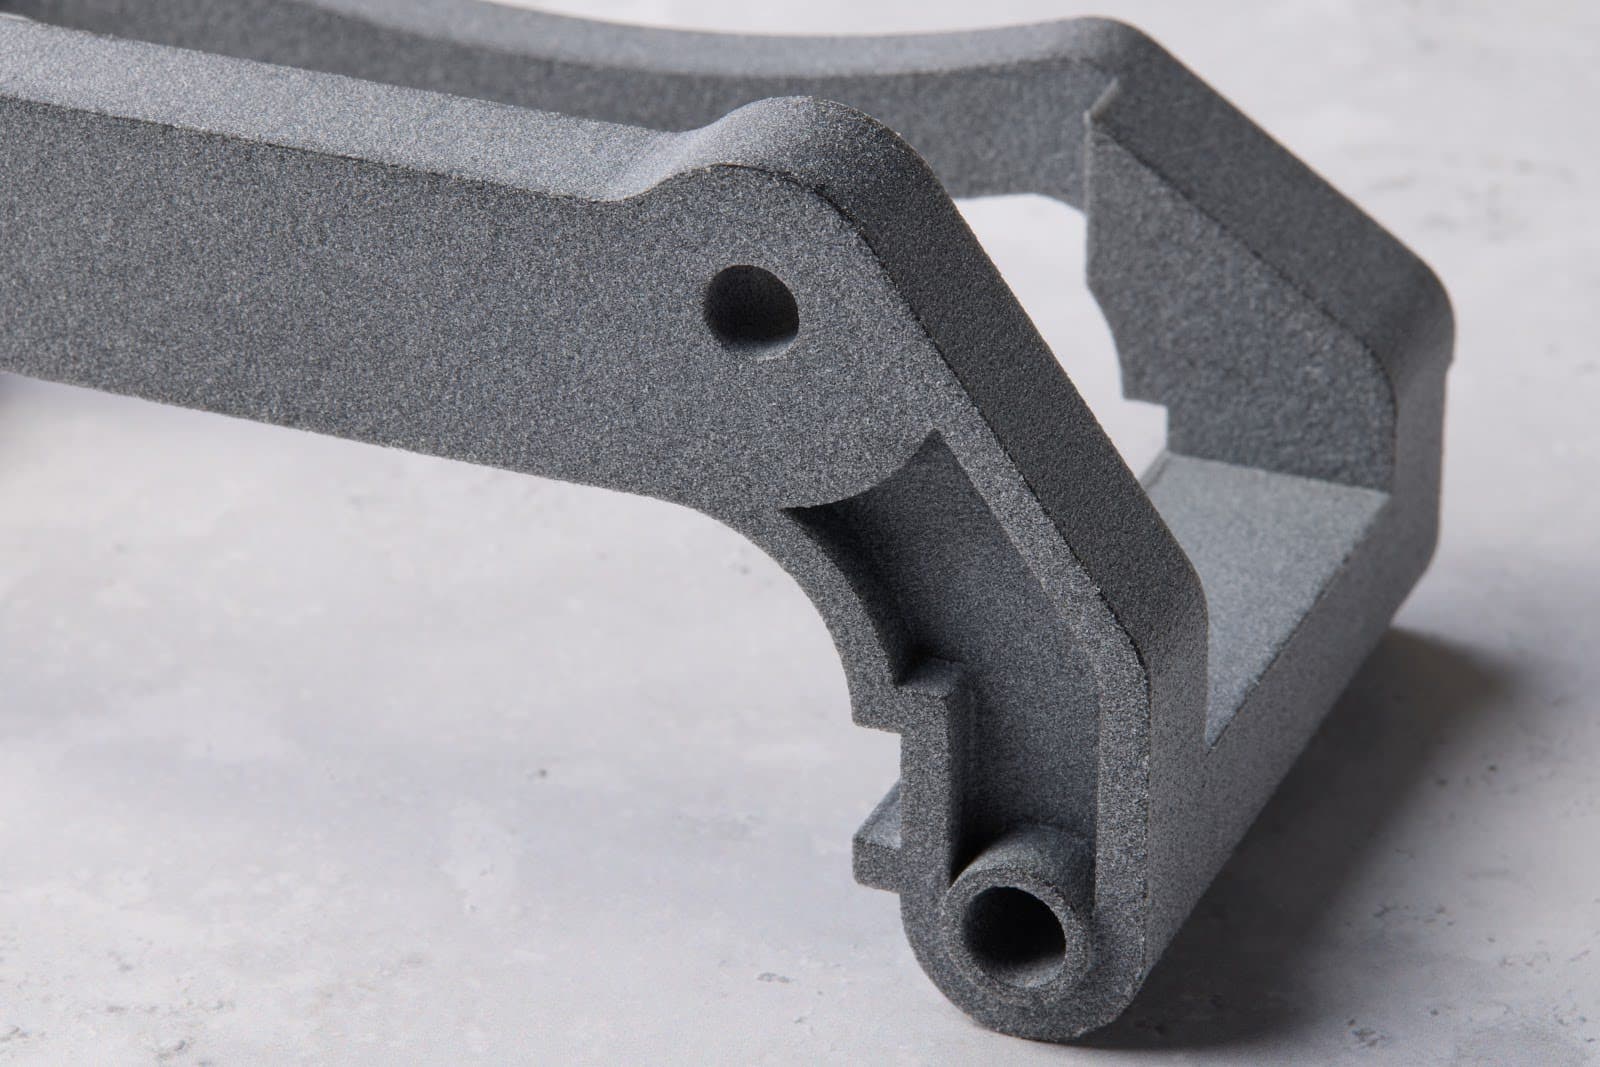
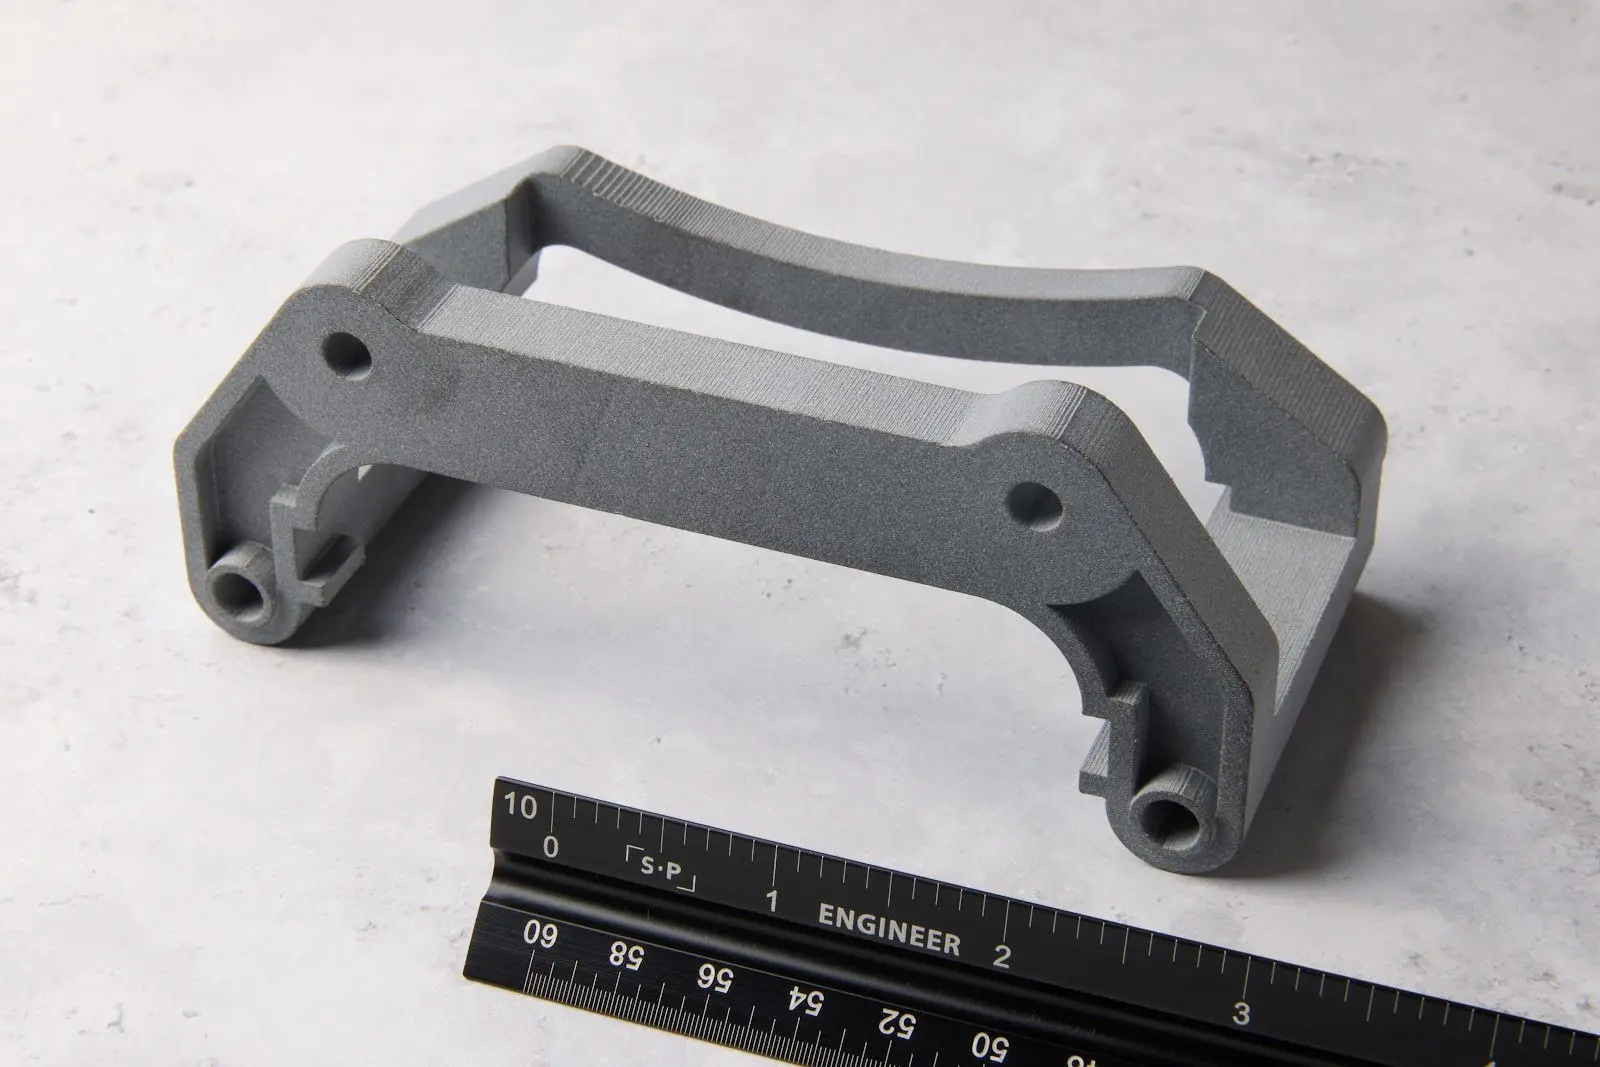
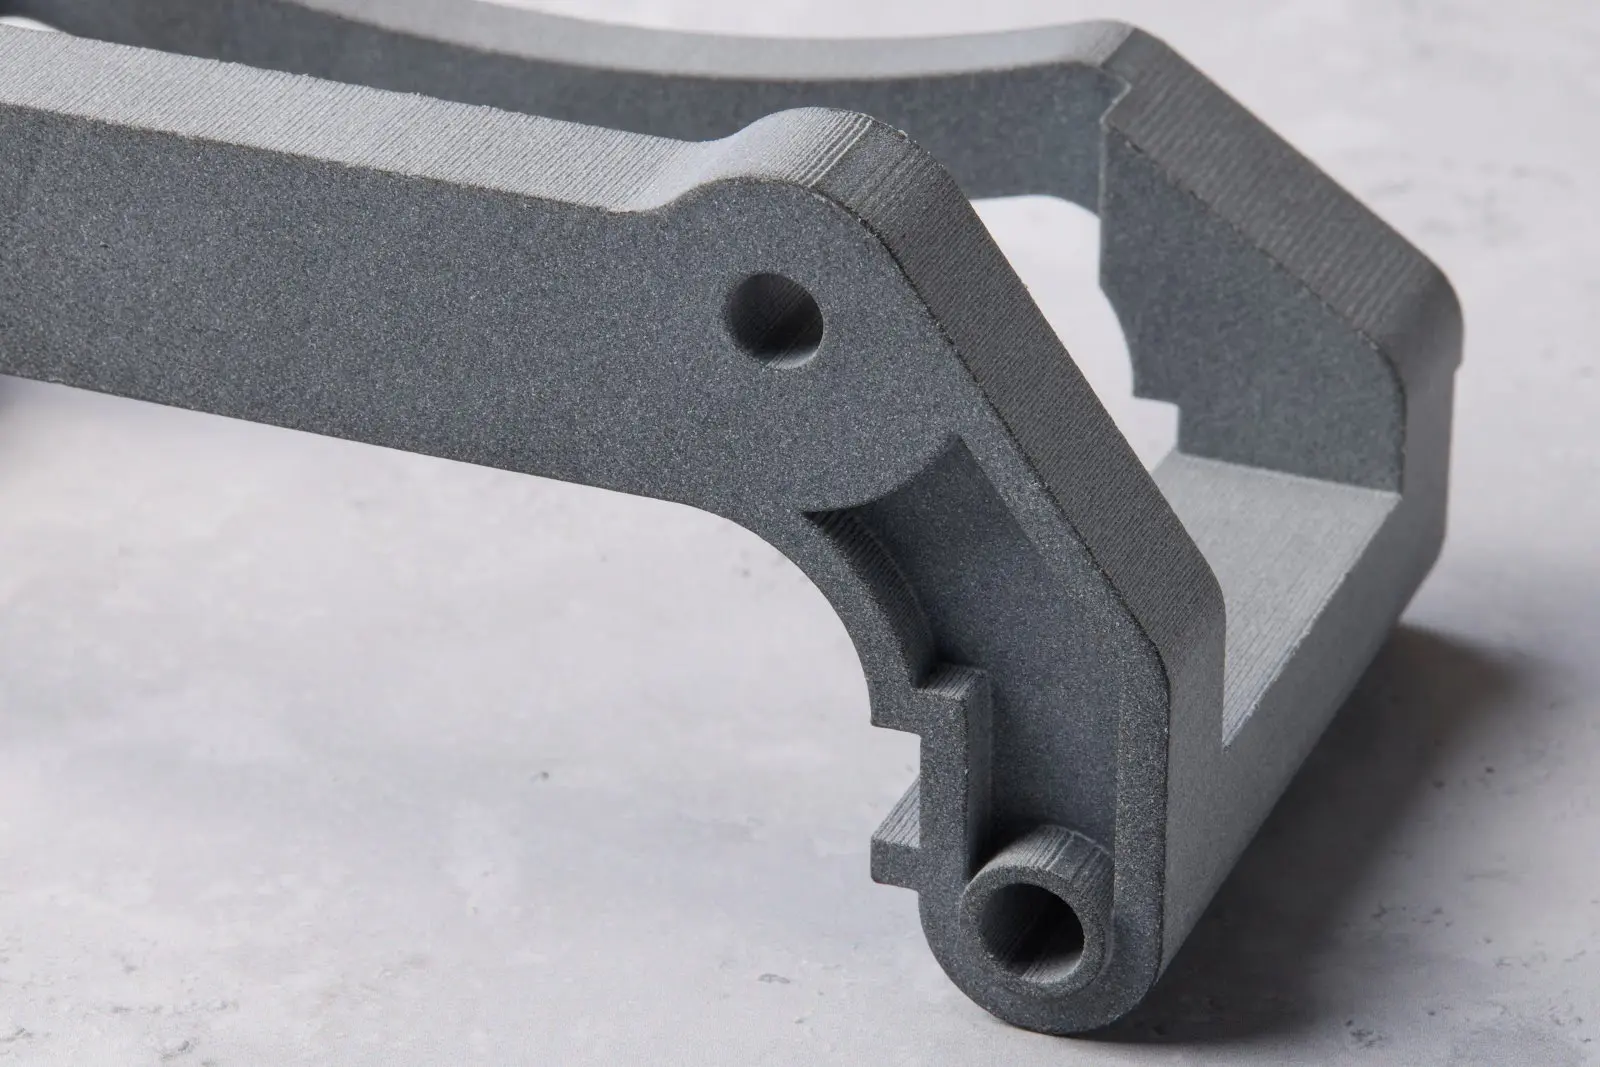
The model selected for this study — the brake caliper — features large flat surfaces in every major plane, four angled planar surfaces, and multiple sloping surfaces, all of which are large enough to give high-quality data. Keeping the part in the same orientation on each printer guarantees that the different features resolve as needed.
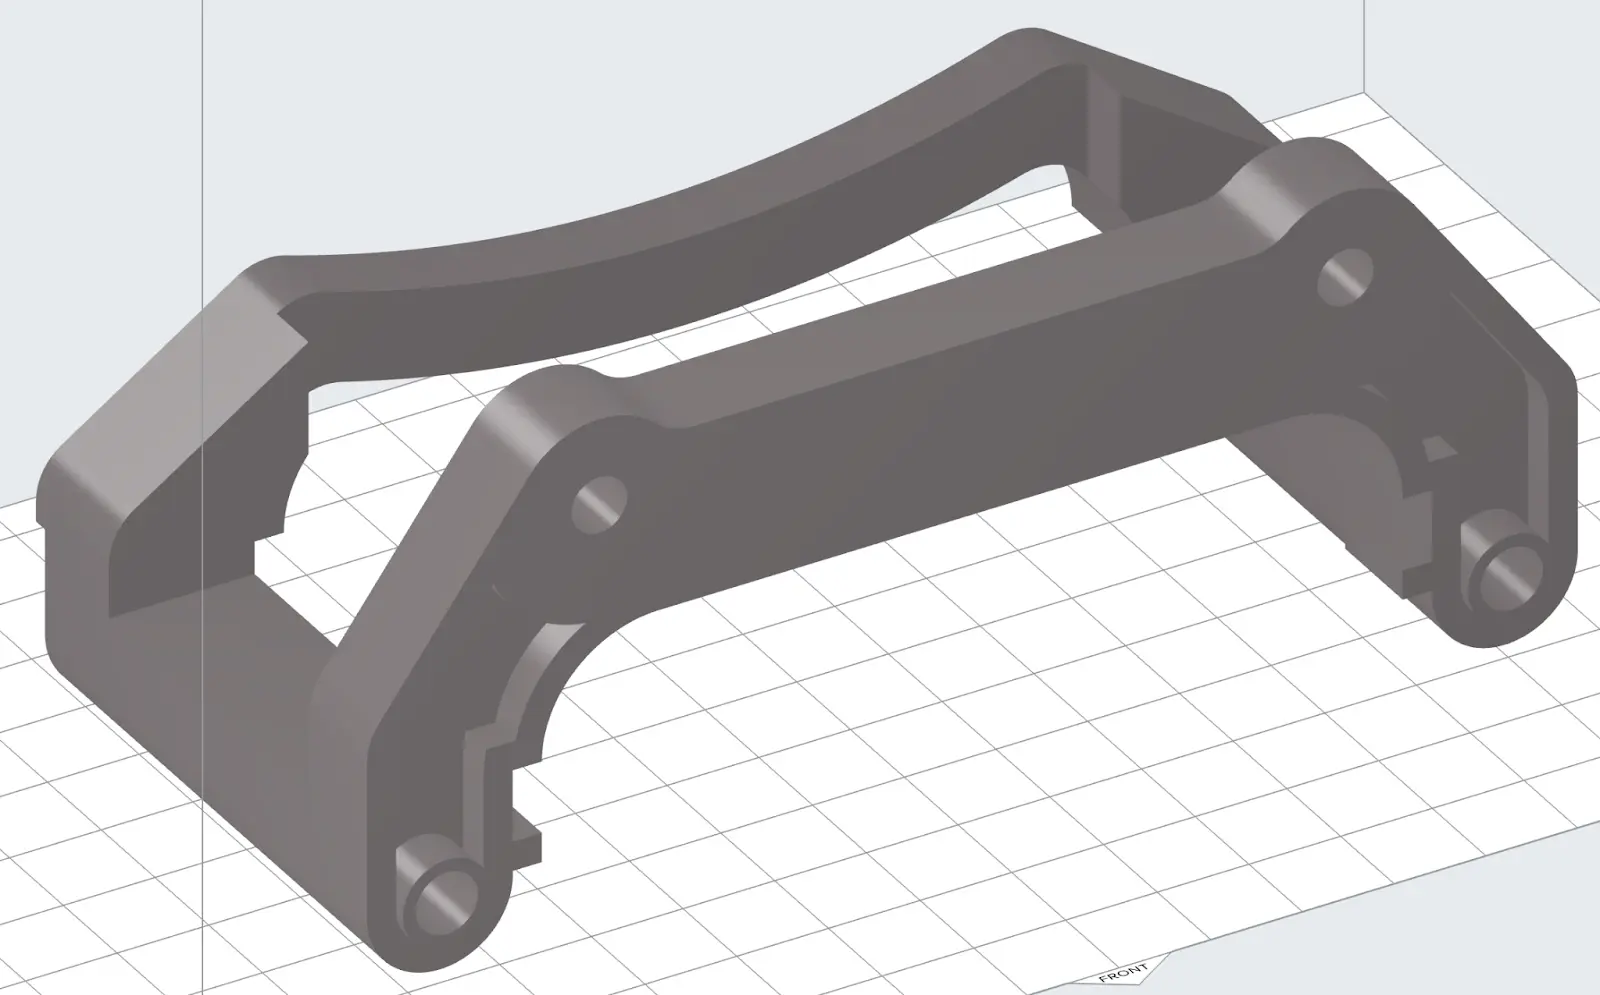
The brake caliper part in PreForm. The part features large flat surfaces in every major plane, four angled planar surfaces, and multiple sloping surfaces.
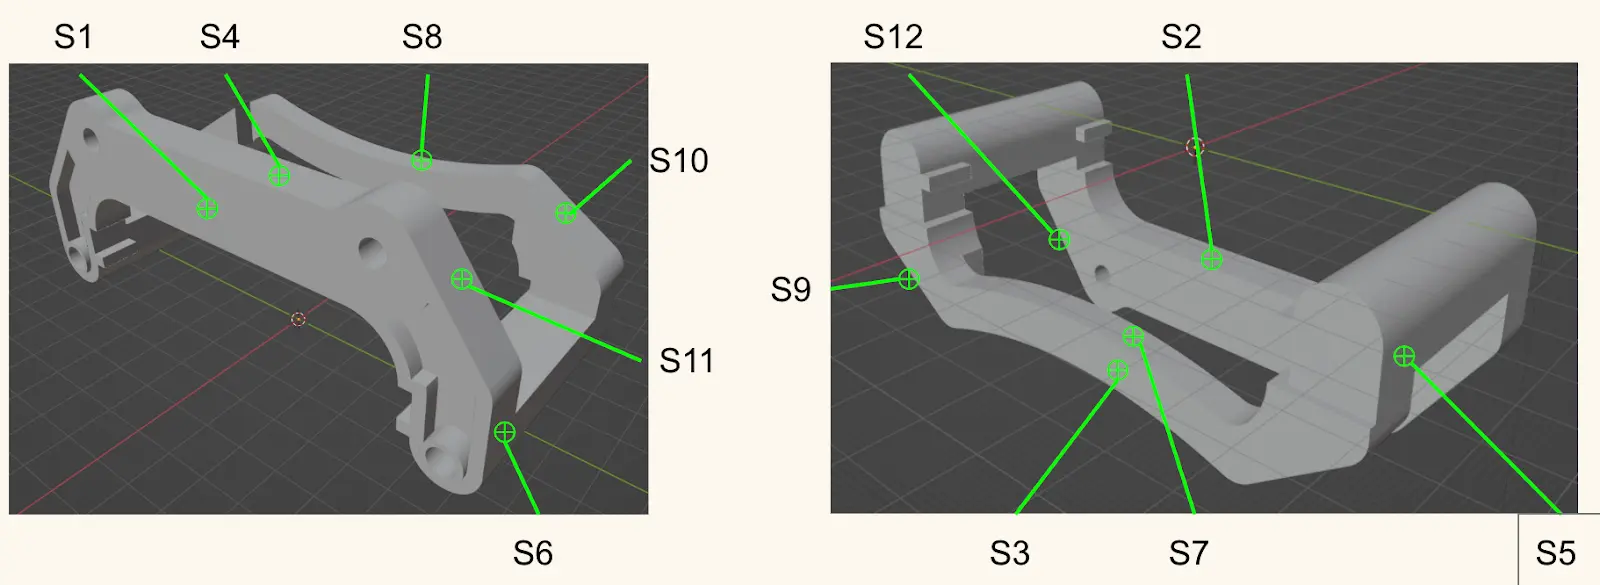
In total, 12 different measurement planes were identified and measured by optical profilometer and contact profilometer methods.
The Materials and Providers
The three powder bed technology (Fuse Series, EOS, HP) printers all used Nylon 12 powder, the most commonly used SLS/MJF material. The Form 4 SLA printer used Formlabs’ proprietary material, Tough 2000 Resin, which is a good comparison to nylon since it is often used in similar applications.
The Fuse Series and Form 4 parts were printed and post-processed in-house by Formlabs, while the HP and EOS parts were printed and post-processed by 3DPX and Materialise.
Request a Free Sample Part
See and feel Formlabs quality firsthand. We’ll ship a free 3D printed sample part to your office.
Detailed Results
Comparison: Standard Surface Finishing Process
The following results detail the comparison between parts when put through the ‘standard’ surface finishing processes recommended by the manufacturers. With no additional post-processing, SLA-printed parts are significantly smoother than SLS- and MJF-printed parts. MJF parts are likewise smoother than the SLS-printed parts, with the two SLS technologies (EOS and Formlabs Fuse 1+30W) giving relatively similar results on average. This does vary based on the exact surface and its orientation. For example, S1, a flat vertically oriented surface, shows a much more significant difference between each material, with Fuse 1+30W far out-performing the EOS part, and being much closer to the MJF part in quality.
Average Ra of all 12 Surfaces:
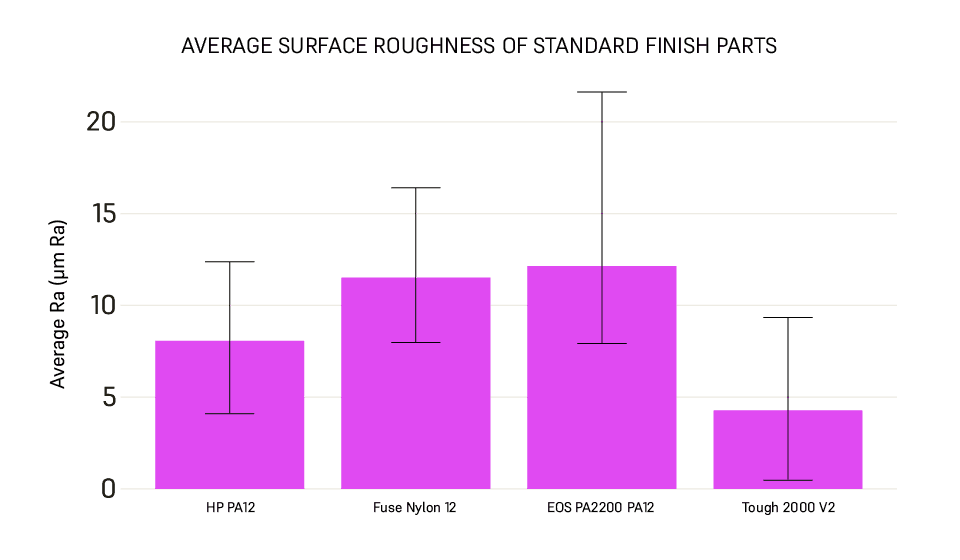
Surface roughness averaged over all 12 faces as measured by a contact profilometer, for each part, following the standard surface finishing process.
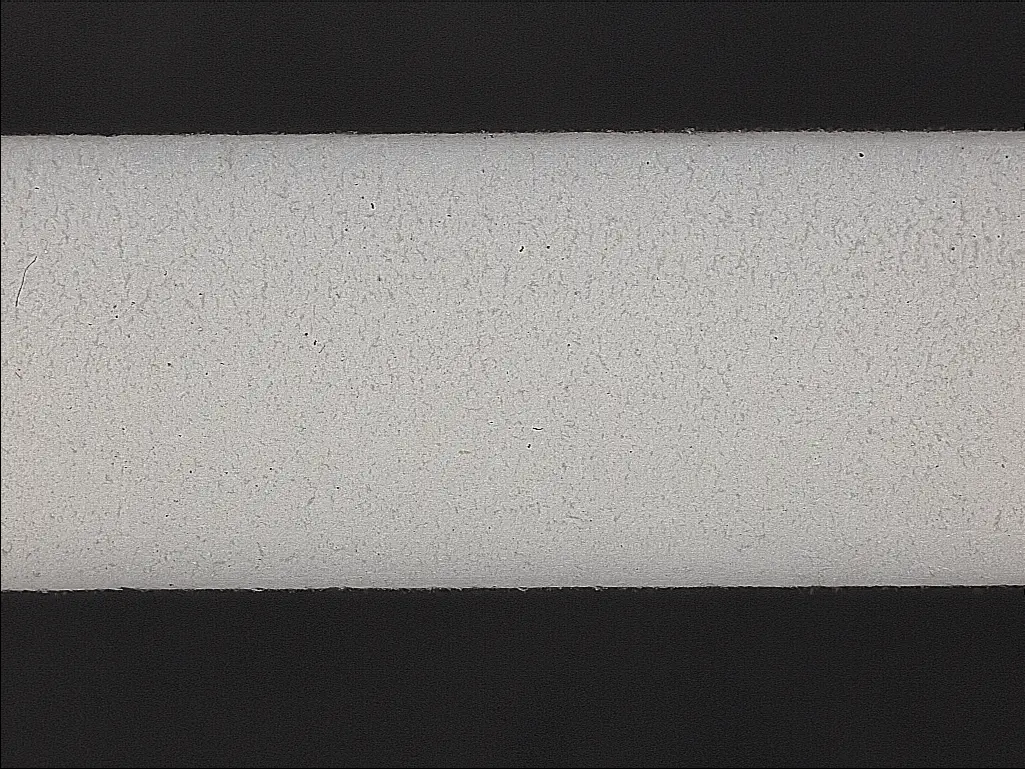
Single Surface Comparison (S1)

Left: the S1 surface of the brake caliper part. Right: Graph showing the variation of the surface roughness on surface S1 for printed parts, all following their standard finishing processes.
Visual Comparison of Curved Surfaces
Looking closely at these images shows several key points on the surface finish. The curved surface, particularly, shows the stair-stepping that occurs when these parts are printed. For most of these, they show up as 100 µm steps, though in some cases they smooth out. On the other hand, the flat face directly facing the camera shows a vertically oriented surface. On the Tough 2000 Resin part, the surface looks almost glass-smooth, while on both the EOS and Fuse Series surfaces, a lot of roughness is visible. The HP part splits the differences somewhat, with a surface that looks almost like cloth.

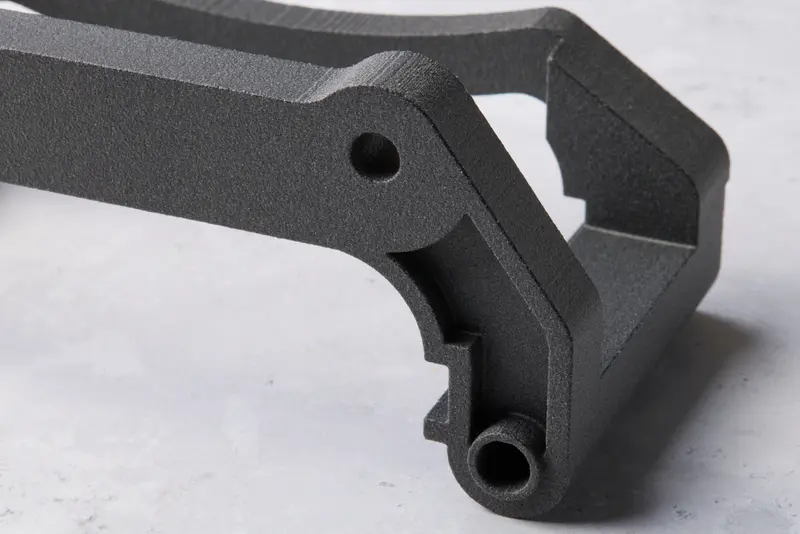
Fuse Series Nylon 12 Powder
EOS PA2200
HP PA12
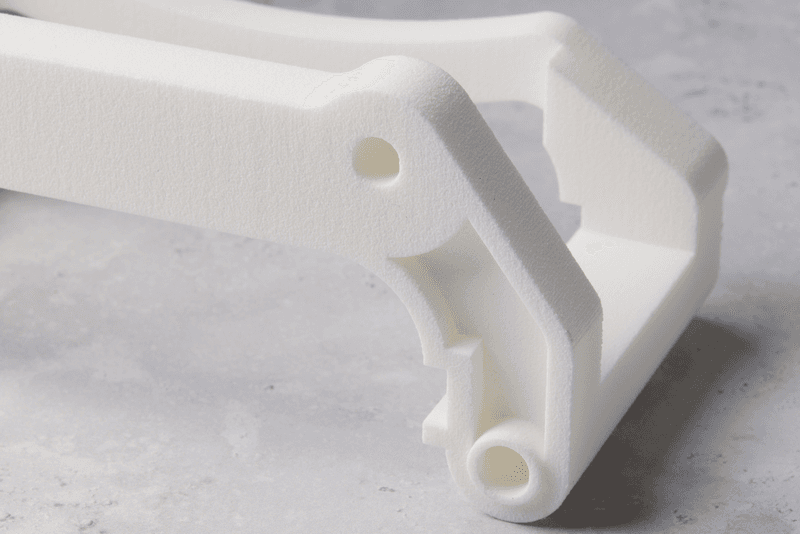
Form 4 Series Tough 2000 Resin
Comparison: Additional Surface Finishing Process
The following results detail the comparison between parts put through an additional surface finishing process. Though this differs between those parts printed in-house on the Fuse 1+ 30W and those outsourced to service bureaus, they represent widely adopted post-processing methods if the surface finish of a part is crucial.
-
Fuse Series SLS parts: Automatically ‘polished’ using Formlabs’ Fuse Blast Polishing System
-
Outsourced EOS parts: Vibratory Tumbling
-
Outsourced HP parts: Vibratory Tumbling
-
Form 4 SLA parts: Since these parts are typically very smooth after the standard processing, there is no additional recommended surface finishing
It’s apparent how much post-processing impacts the average surface finish — the smoothness of Fuse 1+ 30W printed Nylon 12 Powder improves dramatically and is nearly on par with that of the HP PA12 after running the polishing routine.
Fuse Series Nylon 12 Powder: Standard vs. Polishing

Before (left) and after (right) a secondary post-processing step (Fuse Blast Polish).
Parts before and after 'extra' post-processing are shown below from the three powder bed technologies (Fuse Series, EOS, and HP). Because there is no 'extra' version of post-processing for the SLA 3D printed part, the comparison is not shown.
EOS PA2200 Nylon 12: Standard vs. Extra Tumbling
Before (left) and after (right) a secondary post-processing step (extra tumbling).
HP PA12: Standard and Extra Tumbling
Before (left) and after (right) a secondary post-processing step (extra tumbling).
Results By Material
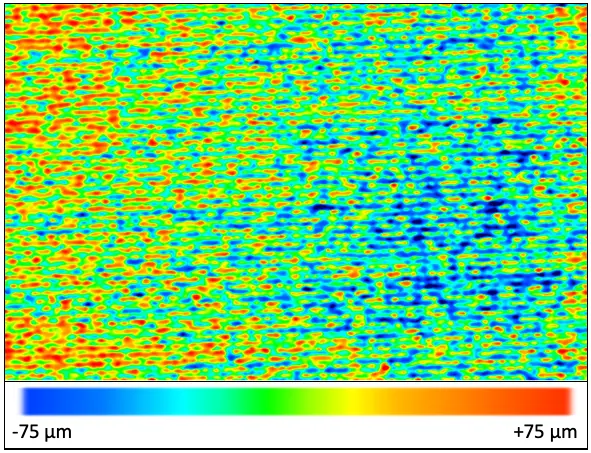
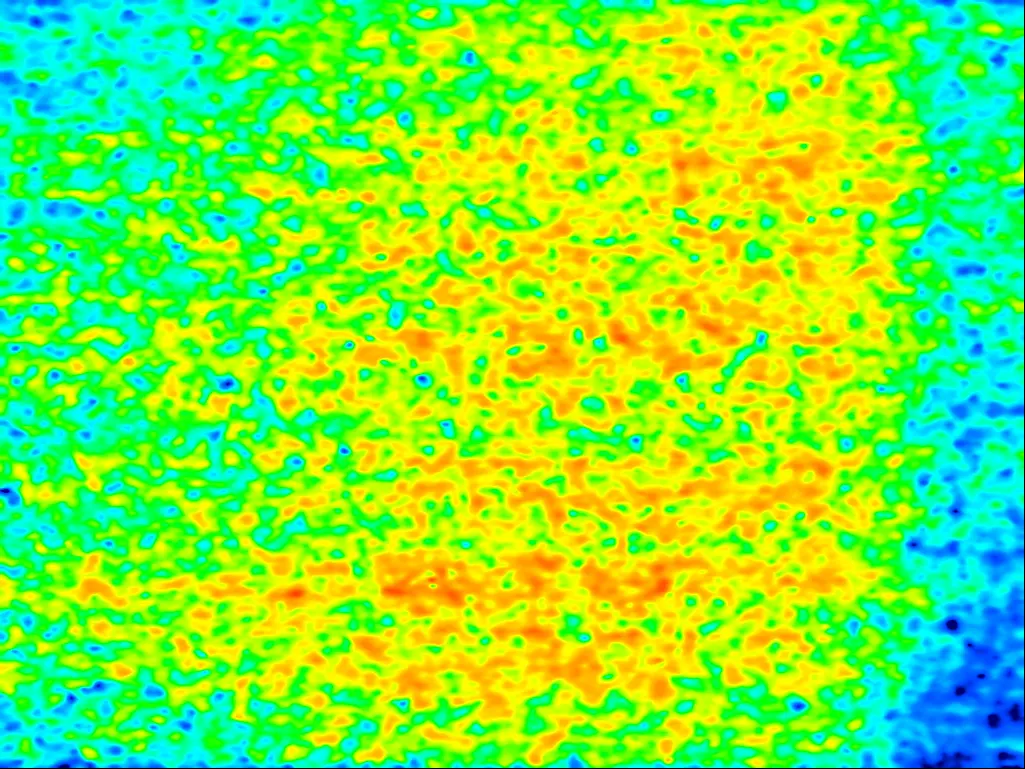
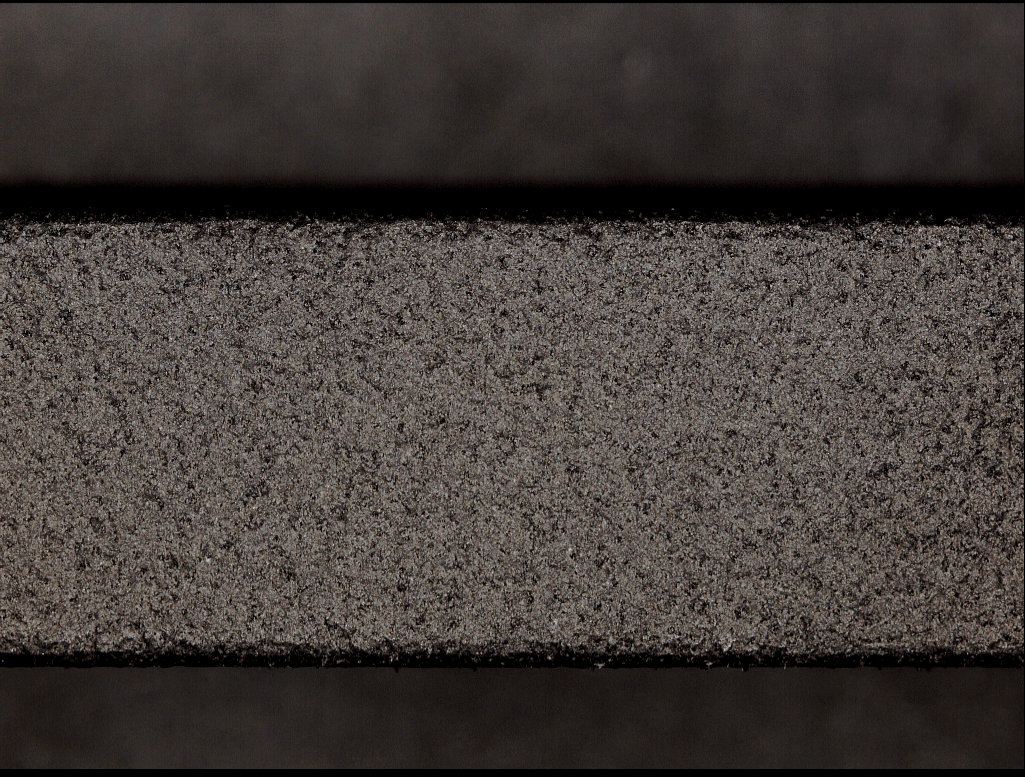
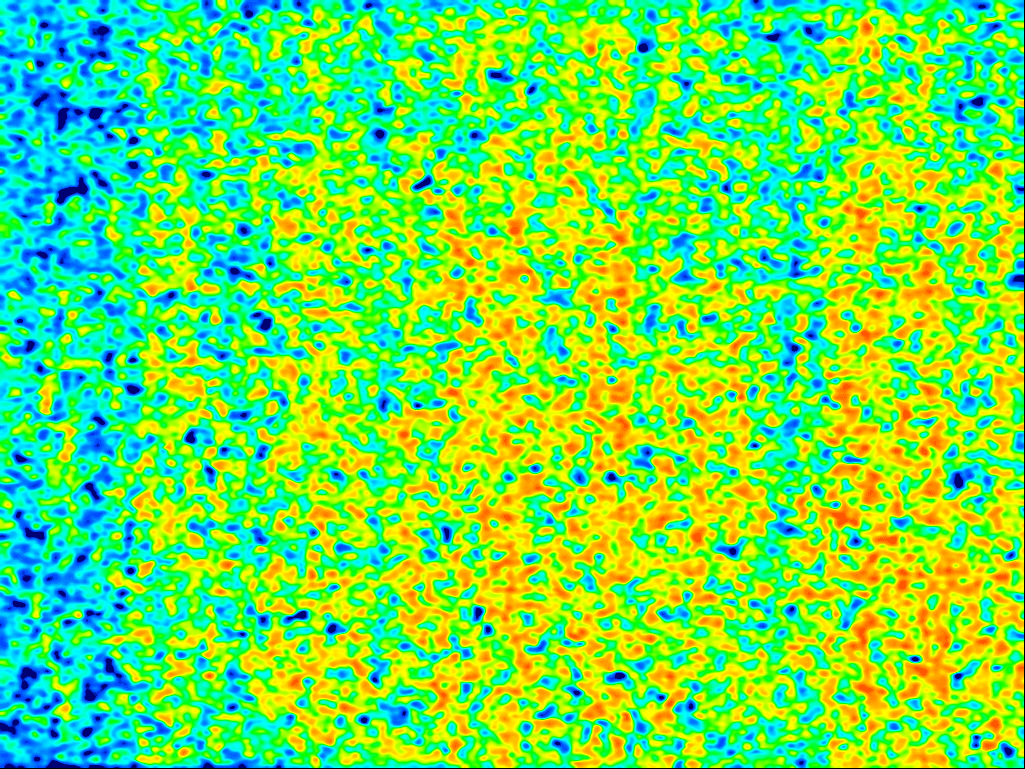
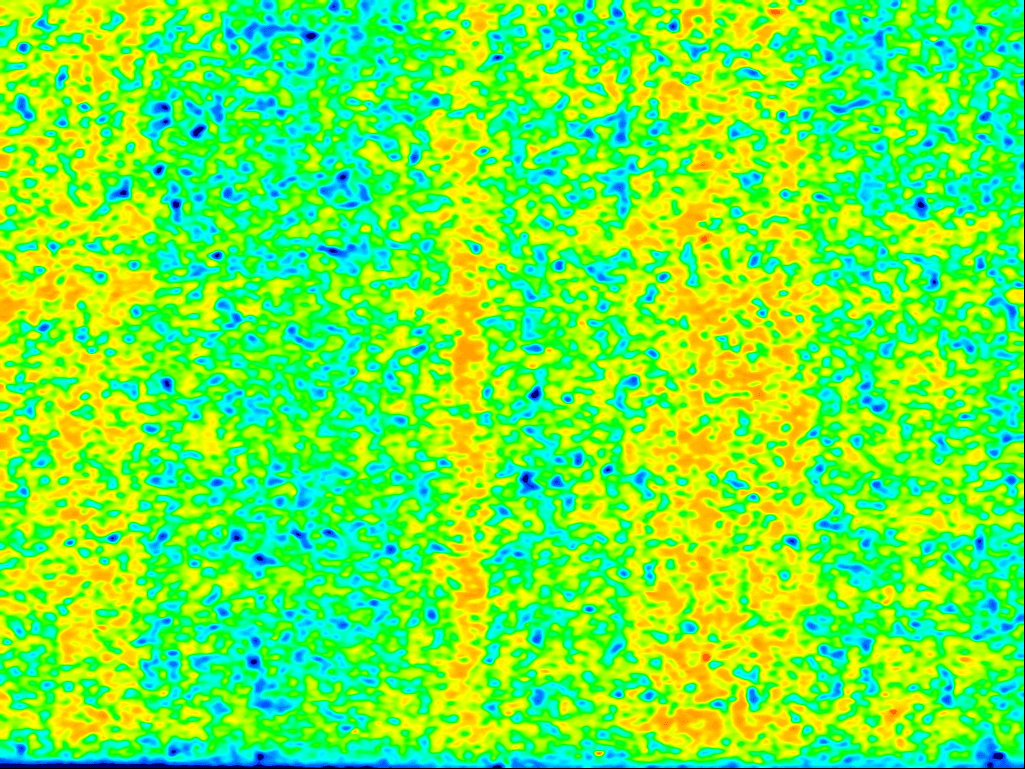
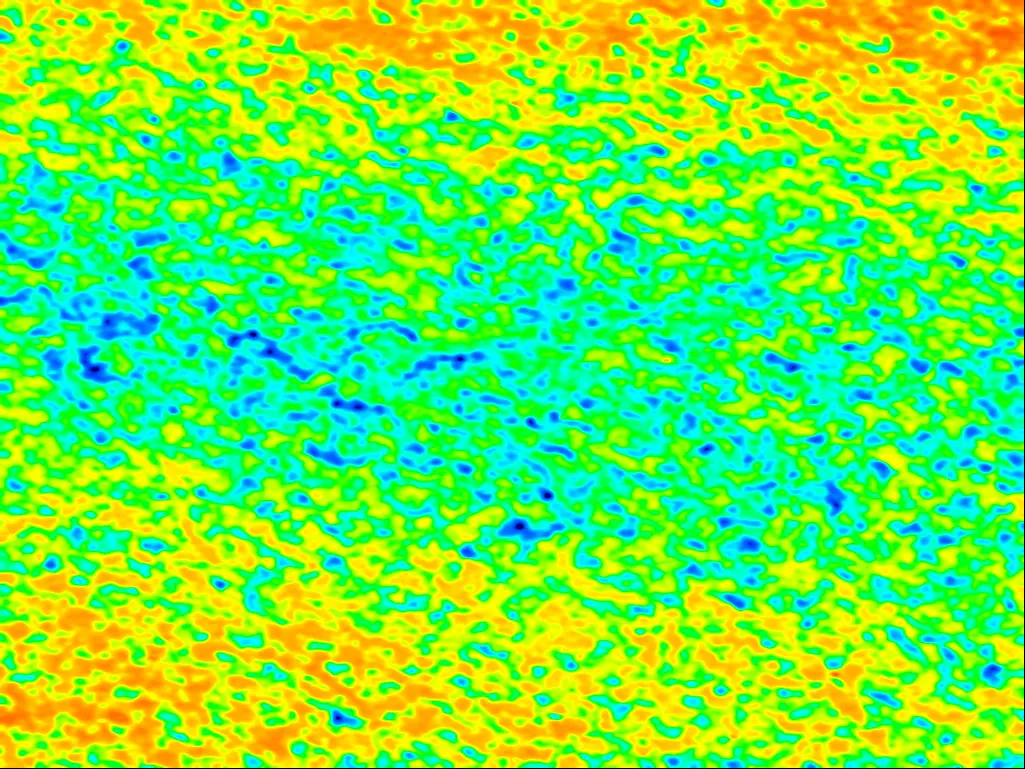
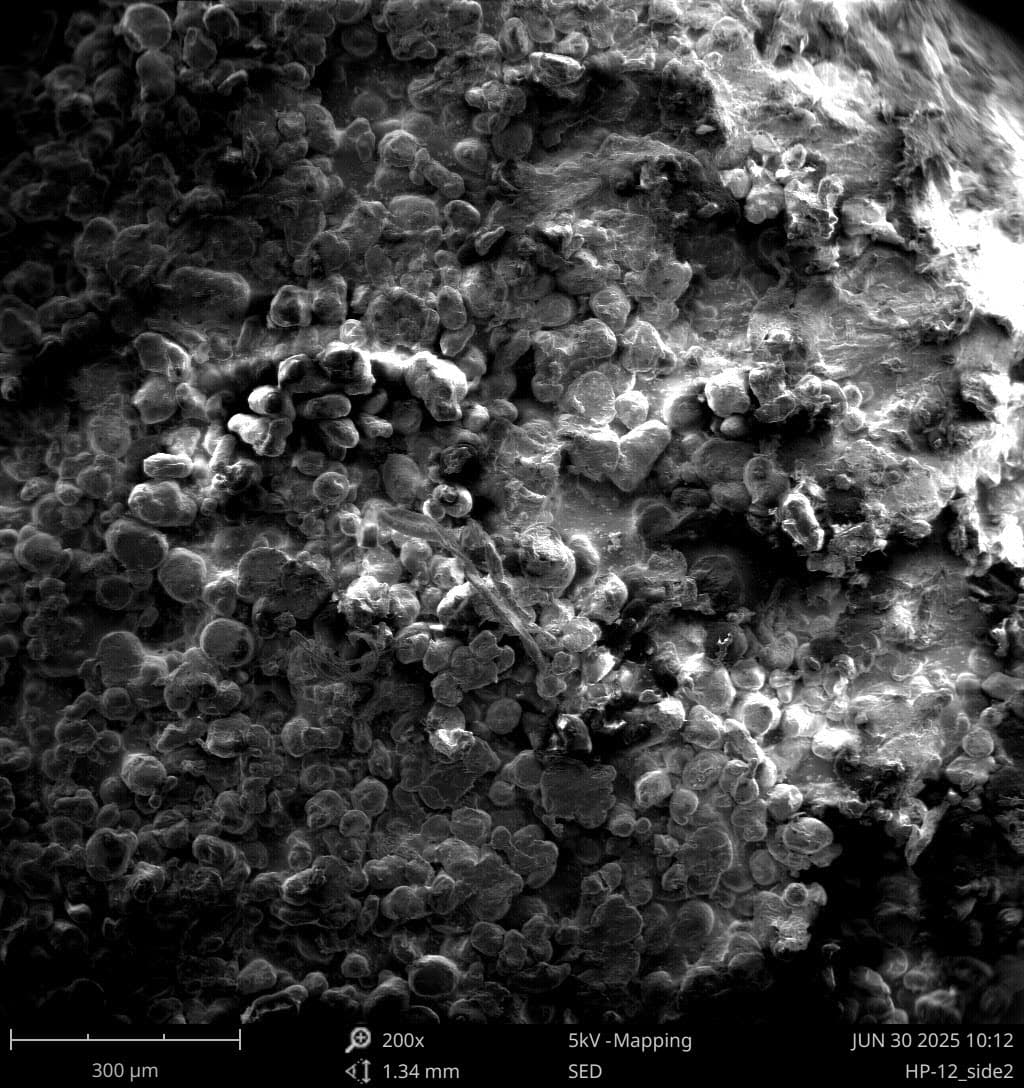
Below are detailed results for each material that was measured. Included are full-size images of the parts for a visual reference, high-resolution close-ups of the parts to see more specifically along the part, a table of the best and worst measurements from each part, either an SEM image where available or an optical microscope image where it is not, and a surface profile along a part. Note that for the surface profiles, the limits of red and blue are kept the same: either +75 µm or -75 µm from the average height.
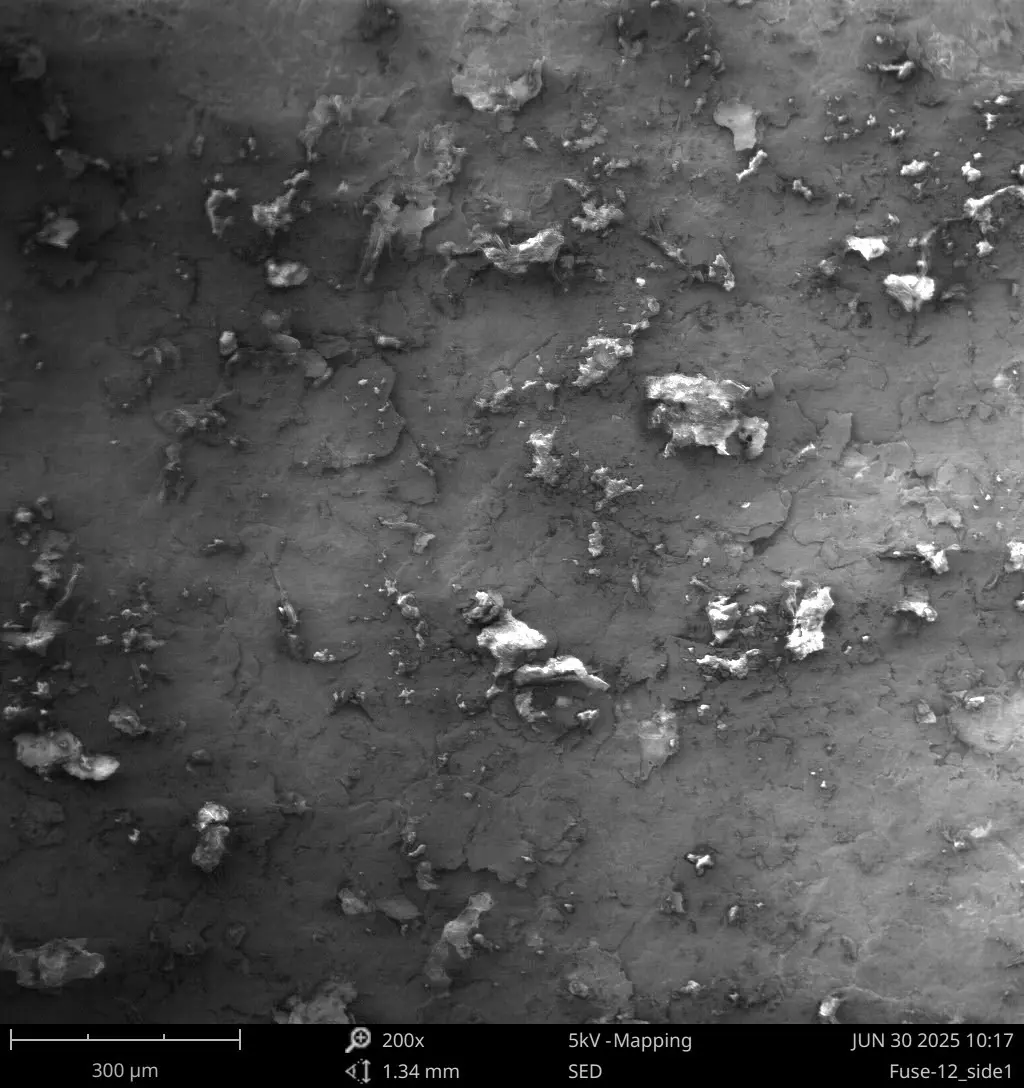
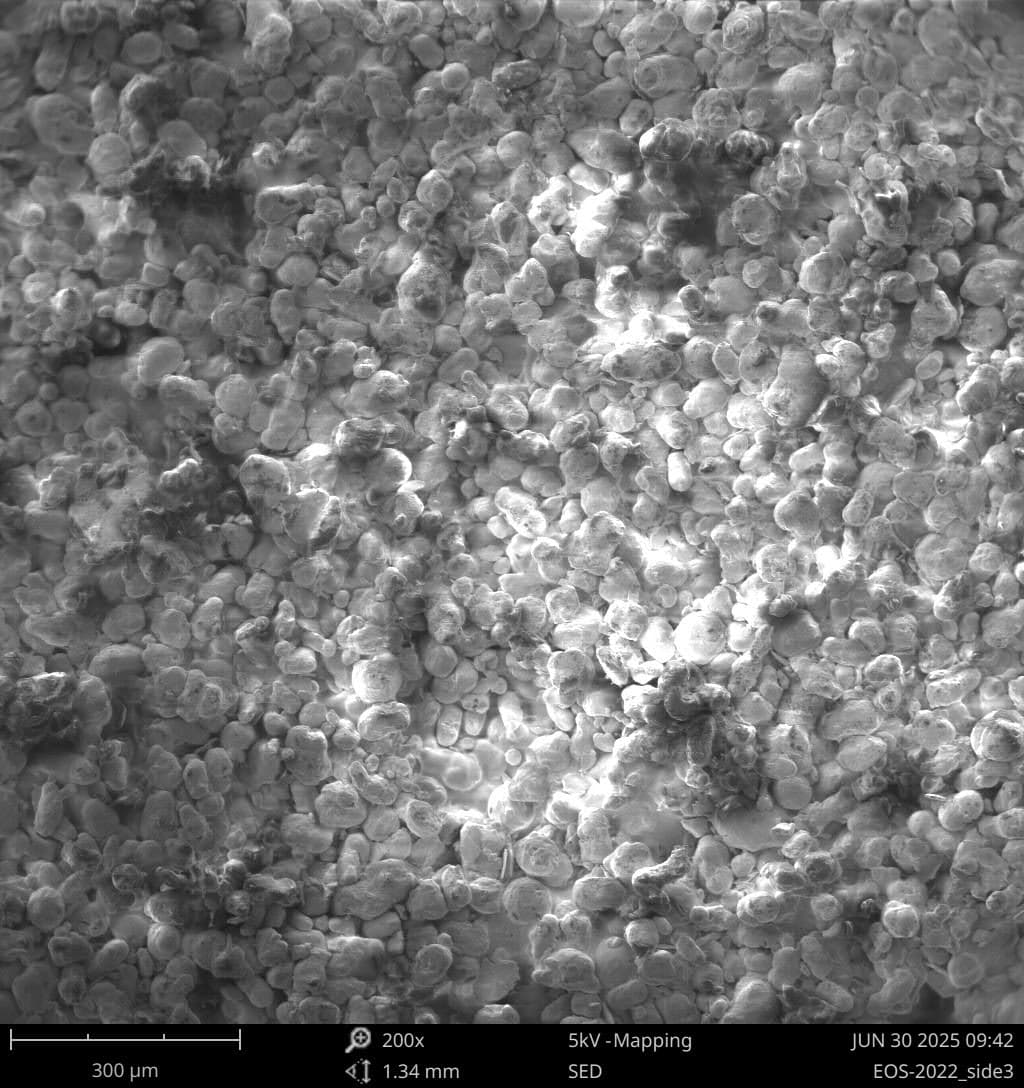
Key points to look out for in these comparisons include zooming in on the images to get a good feel for the visual appearance of any roughness, looking at the SEM micrographs to see how loose material and partially sintered powder drives a lot of the microstructural variation, and looking at the roughness maps to see just how much red/blue appears on each graph, which correlates to more or less variation across the surface.
Fuse Series Standard
Material: Formlabs Nylon 12
Printer: Fuse 1+ 30W
Post Processing: Fuse Blast
Source: Formlabs Internal
| Best | Worst | |
|---|---|---|
| Ra | 8.0 µm | 16.4 µm |
| Rz | 45.5 µm | 83.5 µm |
| Sa | 10.5 µm | 54.1 µm |
| Sz | 117.07 µm | 359.6 µm |
| Gloss | 0.5 GU | - |

Fuse Series Extra
Material: Formlabs Nylon 12
Printer: Fuse 1+ 30W
Post Processing: Fuse Blast + Polish
Source: Formlabs Internal
| Best | Worst | |
|---|---|---|
| Ra | 4.3 µm | 8.9 µm |
| Rz | 20.9 µm | 46.8 µm |
| Sa | 8.8 µm | 50.8µm |
| Sz | 96.5 µm | 310.1 µm |
| Gloss | 2 GU | - |
EOS Standard
Material: EOS PA2200 Nylon 12
Printer: EOS P396
Post Processing: Media Blast
Source: 3DPX

| Best | Worst | |
|---|---|---|
| Ra | 7.9 µm | 21.6 µm |
| Rz | 41.4 µm | 105.7 µm |
| Sa | 12.1 µm | 18.0 µm |
| Sz | 147.8 µm | 206.0 µm |
| Gloss | 2.7 GU | - |
EOS Extra
Material: EOS PA2200 Nylon 12
Printer: EOS P396
Post Processing: Media Blast + Tumbling
Source: 3DPX
| Best | Worst | |
|---|---|---|
| Ra | 4.8 µm | 10.4 µm |
| Rz | 24.5 µm | 52.1 µm |
| Sa | 11.4 µm | 39.5 µm |
| Sz | 122.9 µm | 330.0 µm |
| Gloss | 3.2 GU | - |
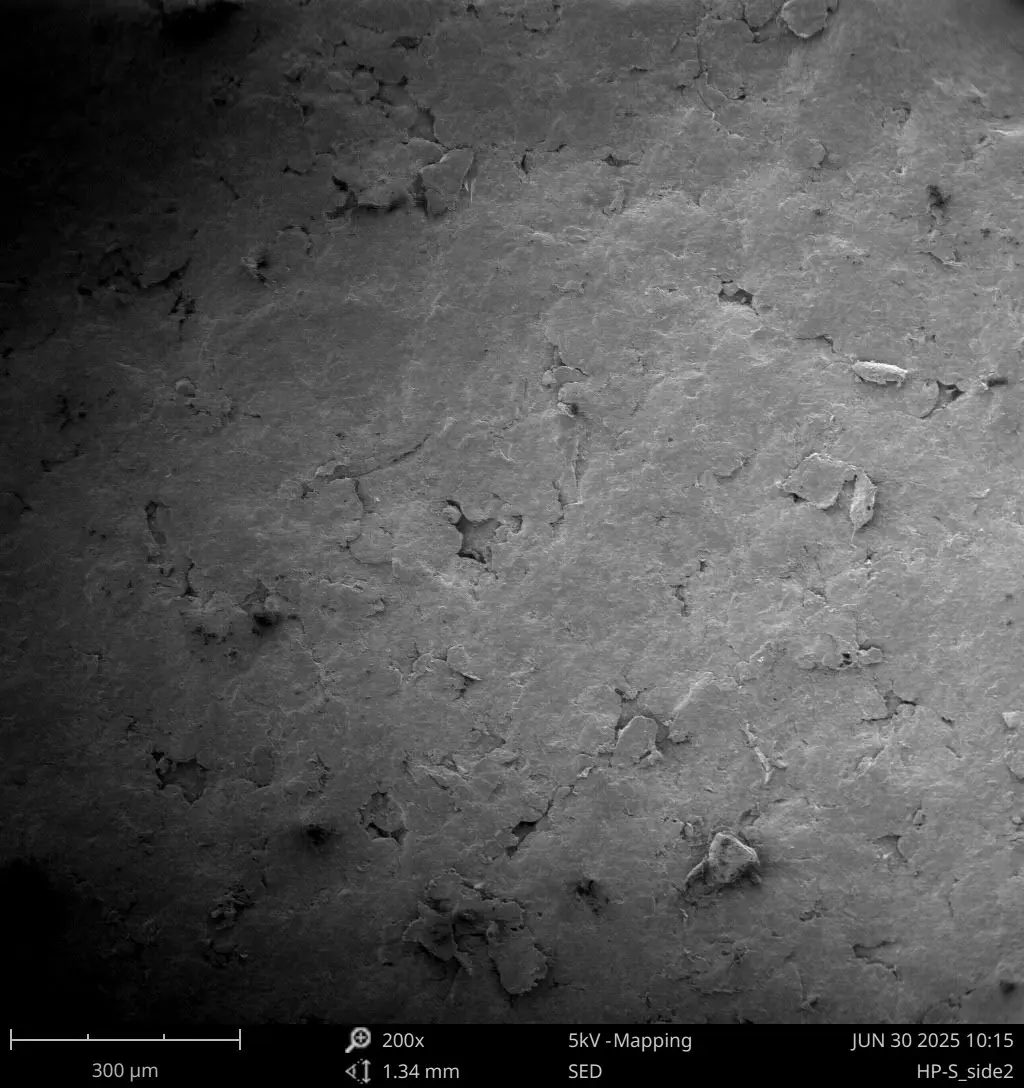
HP Standard
Material: HP 3D HR PA12
Printer: HP Jet Fusion 5600
Post Processing: Bead Blast
Source: Materialise
| Best | Worst | |
|---|---|---|
| Ra | 4.1 µm | 20.9 µm |
| Rz | 21.6 µm | 86.0 µm |
| Sa | 8.4 µm | 83.7 µm |
| Sz | 69.4 µm | 555.0 µm |
| Gloss | 2.1 GU | - |
HP Extra
Material: HP 3D HR PA12
Printer: HP Jet Fusion 5600
Post Processing: Bead Blast + Tumble
Source: Materialise
| Best | Worst | |
|---|---|---|
| Ra | 4.8 µm | 13.6 µm |
| Rz | 23.7 µm | 58.1 µm |
| Sa | 8.8 µm |
35.6 µm |
| Sz | 84.2 µm |
332.1 µm |
| Gloss | 1.9 GU | - |
Conclusion
This study shows that parts printed by SLS and MJF technologies can achieve very similar surface roughnesses. Parts printed on the Formlabs Fuse 1+ 30W in Nylon 12 Powder are somewhat smoother than those printed on EOS SLS printers with EOS PA2200 Nylon 12, though with additional post-processing (Fuse Polishing System and vibratory tumbling, respectively), the two are very similar.
Directly from the printer, MJF parts printed on the HP printer have the smoothest surface finish, though on average, this is only by about 0.2 µm, and the difference is further mitigated by post-processing.
Ecosystem additions, such as the introduction of Formlabs’ Fuse Blast Polishing System, enable users to achieve part surface quality traditionally reserved for systems that cost many hundreds of thousands of dollars more. Post-processing steps like this, combined with print process improvements, are what enable accessible SLS printer systems to produce parts with highly competitive surface finishes, ranging from
4.3 µm Ra to 8.9 µm Ra at the high end when polished.
To test the surface finish of a Fuse 1+ 30W printed part for yourself, request a free SLS 3D printed sample.