
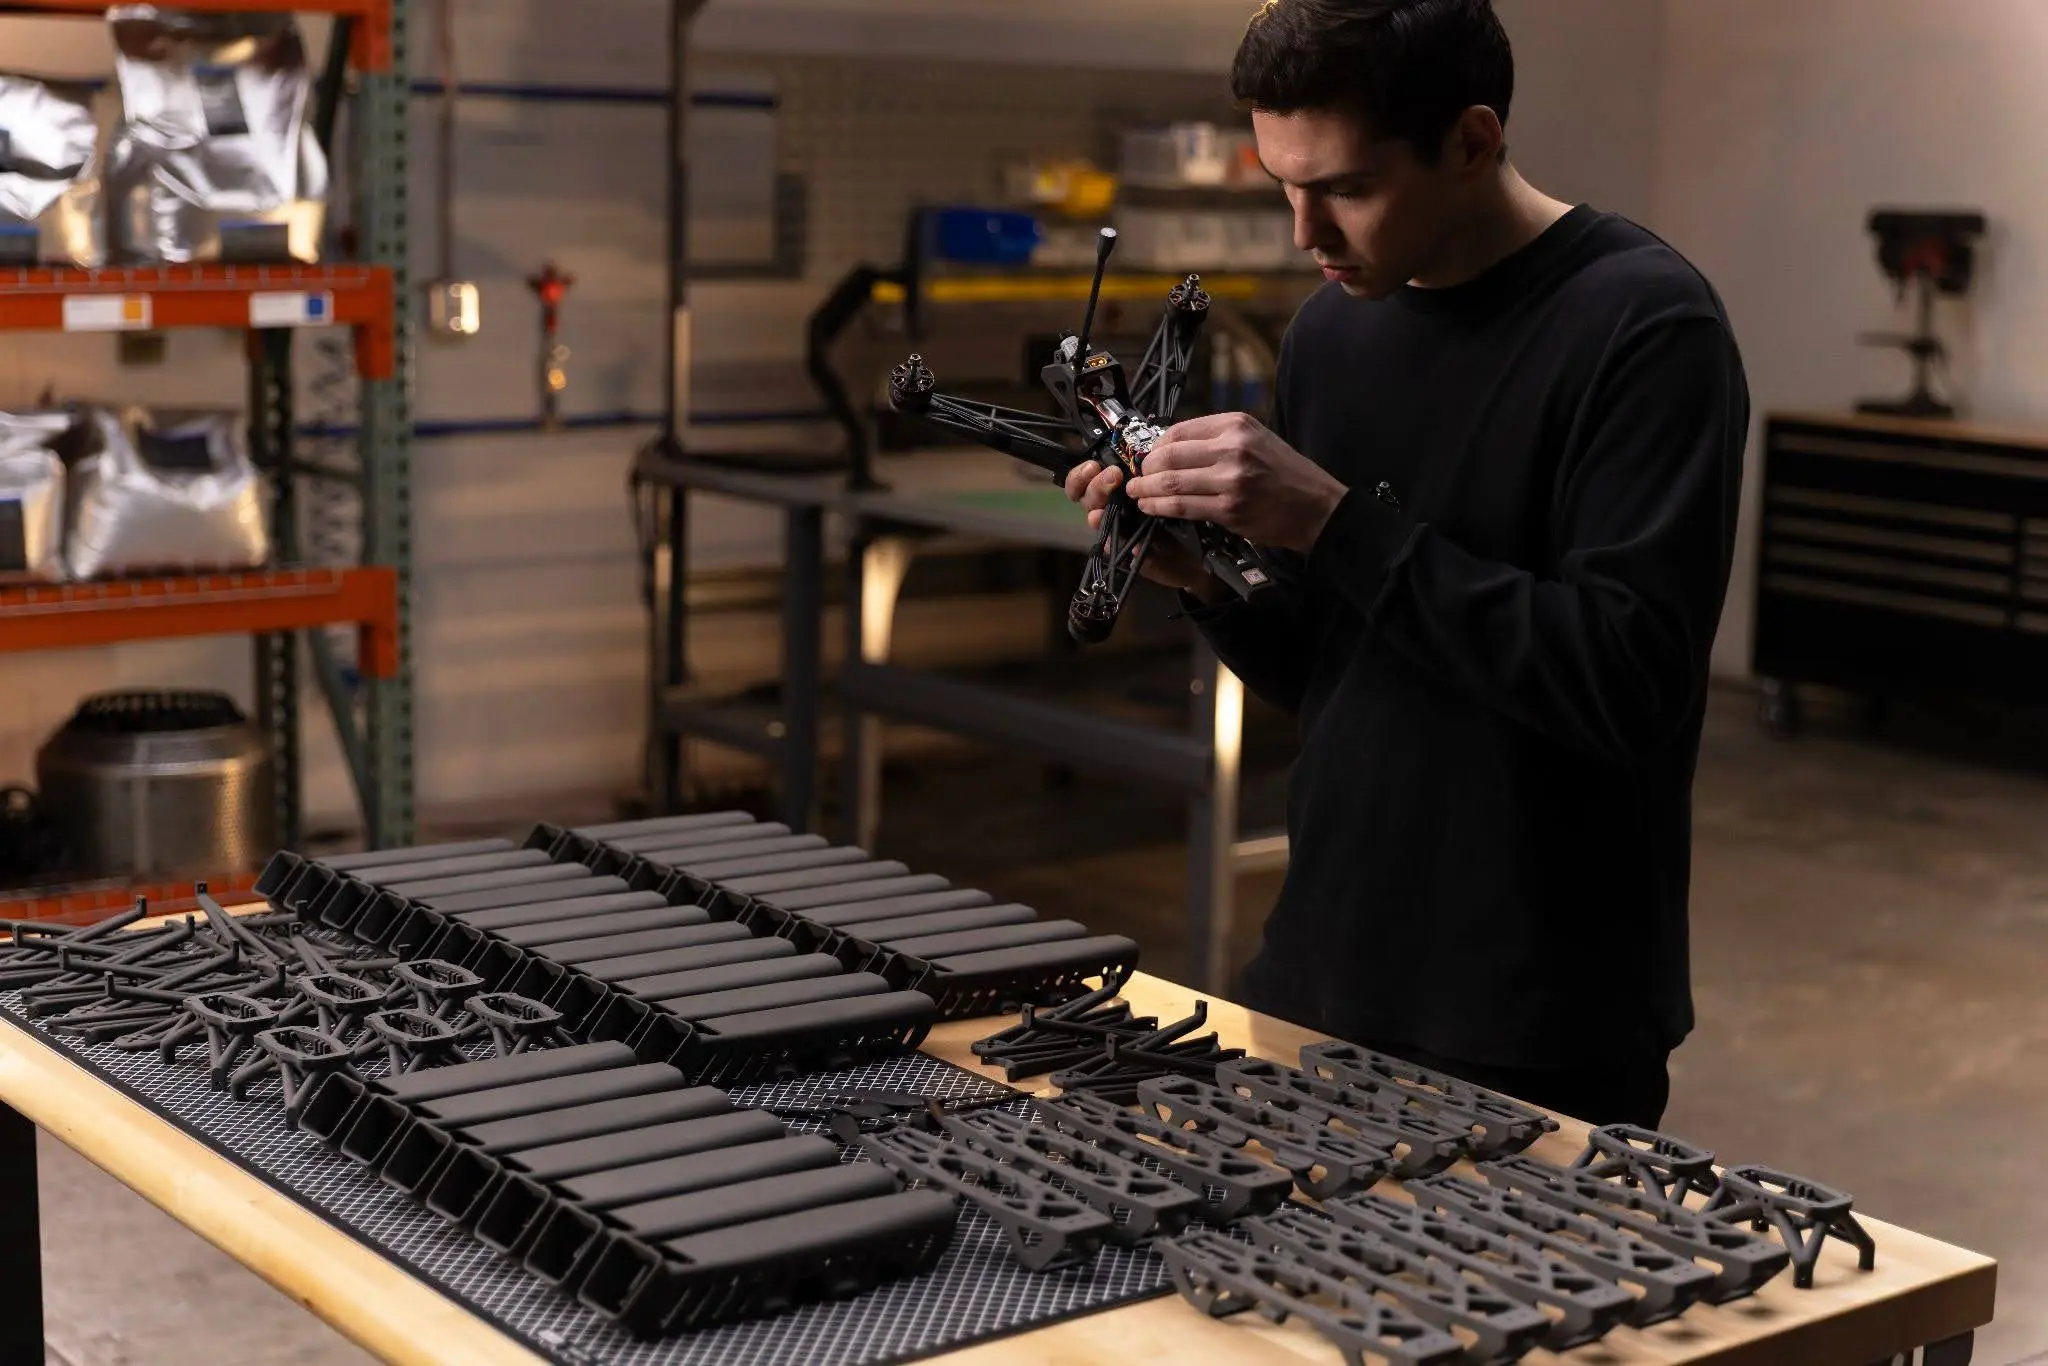

This white paper details the methods and results of a dimensional accuracy study of the Fuse X1 with Nylon 12 Powder, benchmarked against an EOS P396 SLS 3D printer and an HP Jet Fusion 5620 MJF 3D printer using the same witness-cube geometry. Across 467 parts in 14 Fuse X1 builds on 4 printers, the Fuse X1 holds ±0.26–0.33 mm in X/Y and ±0.34–0.67 mm in Z at a process capability of Cpk 1.33 for features up to 80 mm. Additionally, 93% of parts have every one of their 18 measured dimensions within the larger of ±0.3 mm or ±0.5%, as printed, with no part-specific scaling.
Fuse X1 Dimensional Accuracy and Repeatability Study
This white paper details the methods and results of a dimensional accuracy study of the Fuse X1 with Nylon 12 Powder, benchmarked against an EOS P396 SLS 3D printer and an HP Jet Fusion 5620 MJF 3D printer using the same witness-cube geometry. Across 467 parts in 14 Fuse X1 builds on 4 printers, the Fuse X1 holds ±0.26–0.33 mm in X/Y and ±0.34–0.67 mm in Z at a process capability of Cpk 1.33 for features up to 80 mm. Additionally, 93% of parts have every one of their 18 measured dimensions within the larger of ±0.3 mm or ±0.5%, as printed, with no part-specific scaling.
1. Introduction
Plastic powder bed fusion 3D printers let manufacturers produce end-use nylon parts in volume, but only if every build delivers parts that fit their assembly without sorting or rework. That requires two things: parts must be accurate (on average, close to their nominal dimensions) and repeatable (consistent from part to part, build to build and printer to printer).
Dimensional variation in powder bed fusion has three main sources:
-
Part-to-part variation within a build, driven largely by where a part sits in the chamber
-
Build-to-build variation on the same printer
-
Printer-to-printer variation across a fleet
This study quantifies all three for the Fuse X1 and compares the results with two widely used industrial platforms, the EOS P396 selective laser sintering (SLS) 3D printer and the HP Jet Fusion 5620 Multi Jet Fusion (MJF) 3D printer. Every platform printed the same witness cube, and the competitor chambers were packed with PreForm's automatic packing. Results are reported in the formats used across the industry: tolerance at a target process capability (Cpk), part yield at a given tolerance, and ISO 286 International Tolerance (IT) grades.
2. Executive Summary
Fuse X1 delivers industrial-class dimensional accuracy for Nylon 12 parts, matching or exceeding two of the most widely used industrial powder-bed fusion platforms, and it does so consistently across printers, builds, and build layouts.
-
On par in X/Y accuracy, best in Z: Fuse X1 matches the EOS P396 and HP's published Multi Jet Fusion capability in X and Y, and, as printed, it is the most accurate of the three platforms tested in Z, at every feature size.
-
Highest part yield, as printed: When every critical dimension must be within tolerance simultaneously, the Fuse X1 delivers the highest percentage of parts meeting all dimensional requirements straight out of the printer, at both standard and tight SLS tolerances.
-
Holds up against a best-case comparison: Even after applying offset and scale corrections fitted to their measured results, an after-the-fact adjustment unavailable to users before printing, the Fuse X1 remains competitive with the EOS P396 and outperforms the HP Jet Fusion 5620.
-
Consistent from printer to printer: Four Fuse X1 printers performed consistently as delivered from the factory, with no dimensional tuning. Scaling from a single printer to a fleet required virtually no additional dimensional tolerance.
-
Consistent across builds, highly repeatable by position: Builds on the same printer show strong consistency, with parts printed in the same build position repeating within a few hundredths of a millimeter. For high-volume production, this repeatability creates an opportunity to achieve even tighter tolerances through position-specific compensation.
-
Proven on real production layouts: The Fuse X1 results include full chambers of test parts as well as mixed production builds, with different thermal histories, layer times, and powder-cake structures. Fuse X1 users can expect this accuracy on their own builds, not only on a test layout.
Section 9 summarizes the detailed results.
3. Background: Understanding Process Capability
3.1 Accuracy and Precision
Accuracy measures how close the average dimension is to nominal, while precision (repeatability) measures how closely parts match one another. A consistent offset can be corrected through calibration; variation between parts cannot.

Figure 1. Accuracy versus precision.
3.2 Cp and Cpk
The process capability Cp compares the width of the tolerance band to the process spread (Cp = (USL − LSL) / 6σ). The process capability index Cpk also accounts for how far the process mean μ sits from nominal: Cpk = min(USL − μ, μ − LSL) / 3σ. For a symmetric tolerance ±T, the smallest tolerance that achieves a target Cpk is T = |μ − nominal| + 3·Cpk·σ. This paper follows HP's convention and reports T for Cpk 1.33 (|μ| + 4σ) and Cpk 1.00 (|μ| + 3σ).
|
Cpk |
Sigma level |
Dimensions in spec |
Out of spec (ppm) |
|---|---|---|---|
|
0.67 |
2 |
95.45% |
45,500 |
|
1.00 |
3 |
99.73% |
2,700 |
|
1.33 |
4 |
99.994% |
63 |
|
1.67 |
5 |
99.99994% |
0.6 |
Table 1. Cpk and the corresponding share of dimensions in specification, assuming a normally distributed, centered process.
In practice: this report gives the ± tolerance needed to reach Cpk 1.33. For example, Fuse X1 needs ±0.26 mm for X/Y features of 0–30 mm (Table 3). If a part's X/Y features in that size range are toleranced at ±0.26 mm, at most about 63 in every million printed features would be expected to fall outside the tolerance.

Figure 2. Graphic representation of the acceptable range of Cpk for manufacturing processes.
A Cpk of 1.33 is the usual minimum for production; 1.67 is typical for medical and aerospace. Cpk assumes approximately normal data. Powder-bed fusion errors are often skewed by position in the chamber, so this paper also reports empirical part yield (Section 6), which counts actual in-tolerance parts instead of relying on a statistical model.
3.3 International Tolerance (IT) Grades
ISO 286 defines standard tolerance grades (IT grades) whose allowed tolerance grows with nominal size. Lower grades are tighter: grades up to about IT11 cover precision fits, and IT12–IT16 cover general manufacturing tolerances. Following the convention used in published HP and Formlabs dimensional-capability reports, the IT value is applied as a ± tolerance.
4. Evaluation and Testing Method
4.1 Test Part
Each witness cube has nested features at six nominal sizes (8, 18, 30, 45, 60 and 80 mm) along each of the three printer axes, giving 18 measurements per part. These dimensions match the six critical measurements used in HP's diagnostic part, enabling a direct, range-by-range comparison with HP's published values.
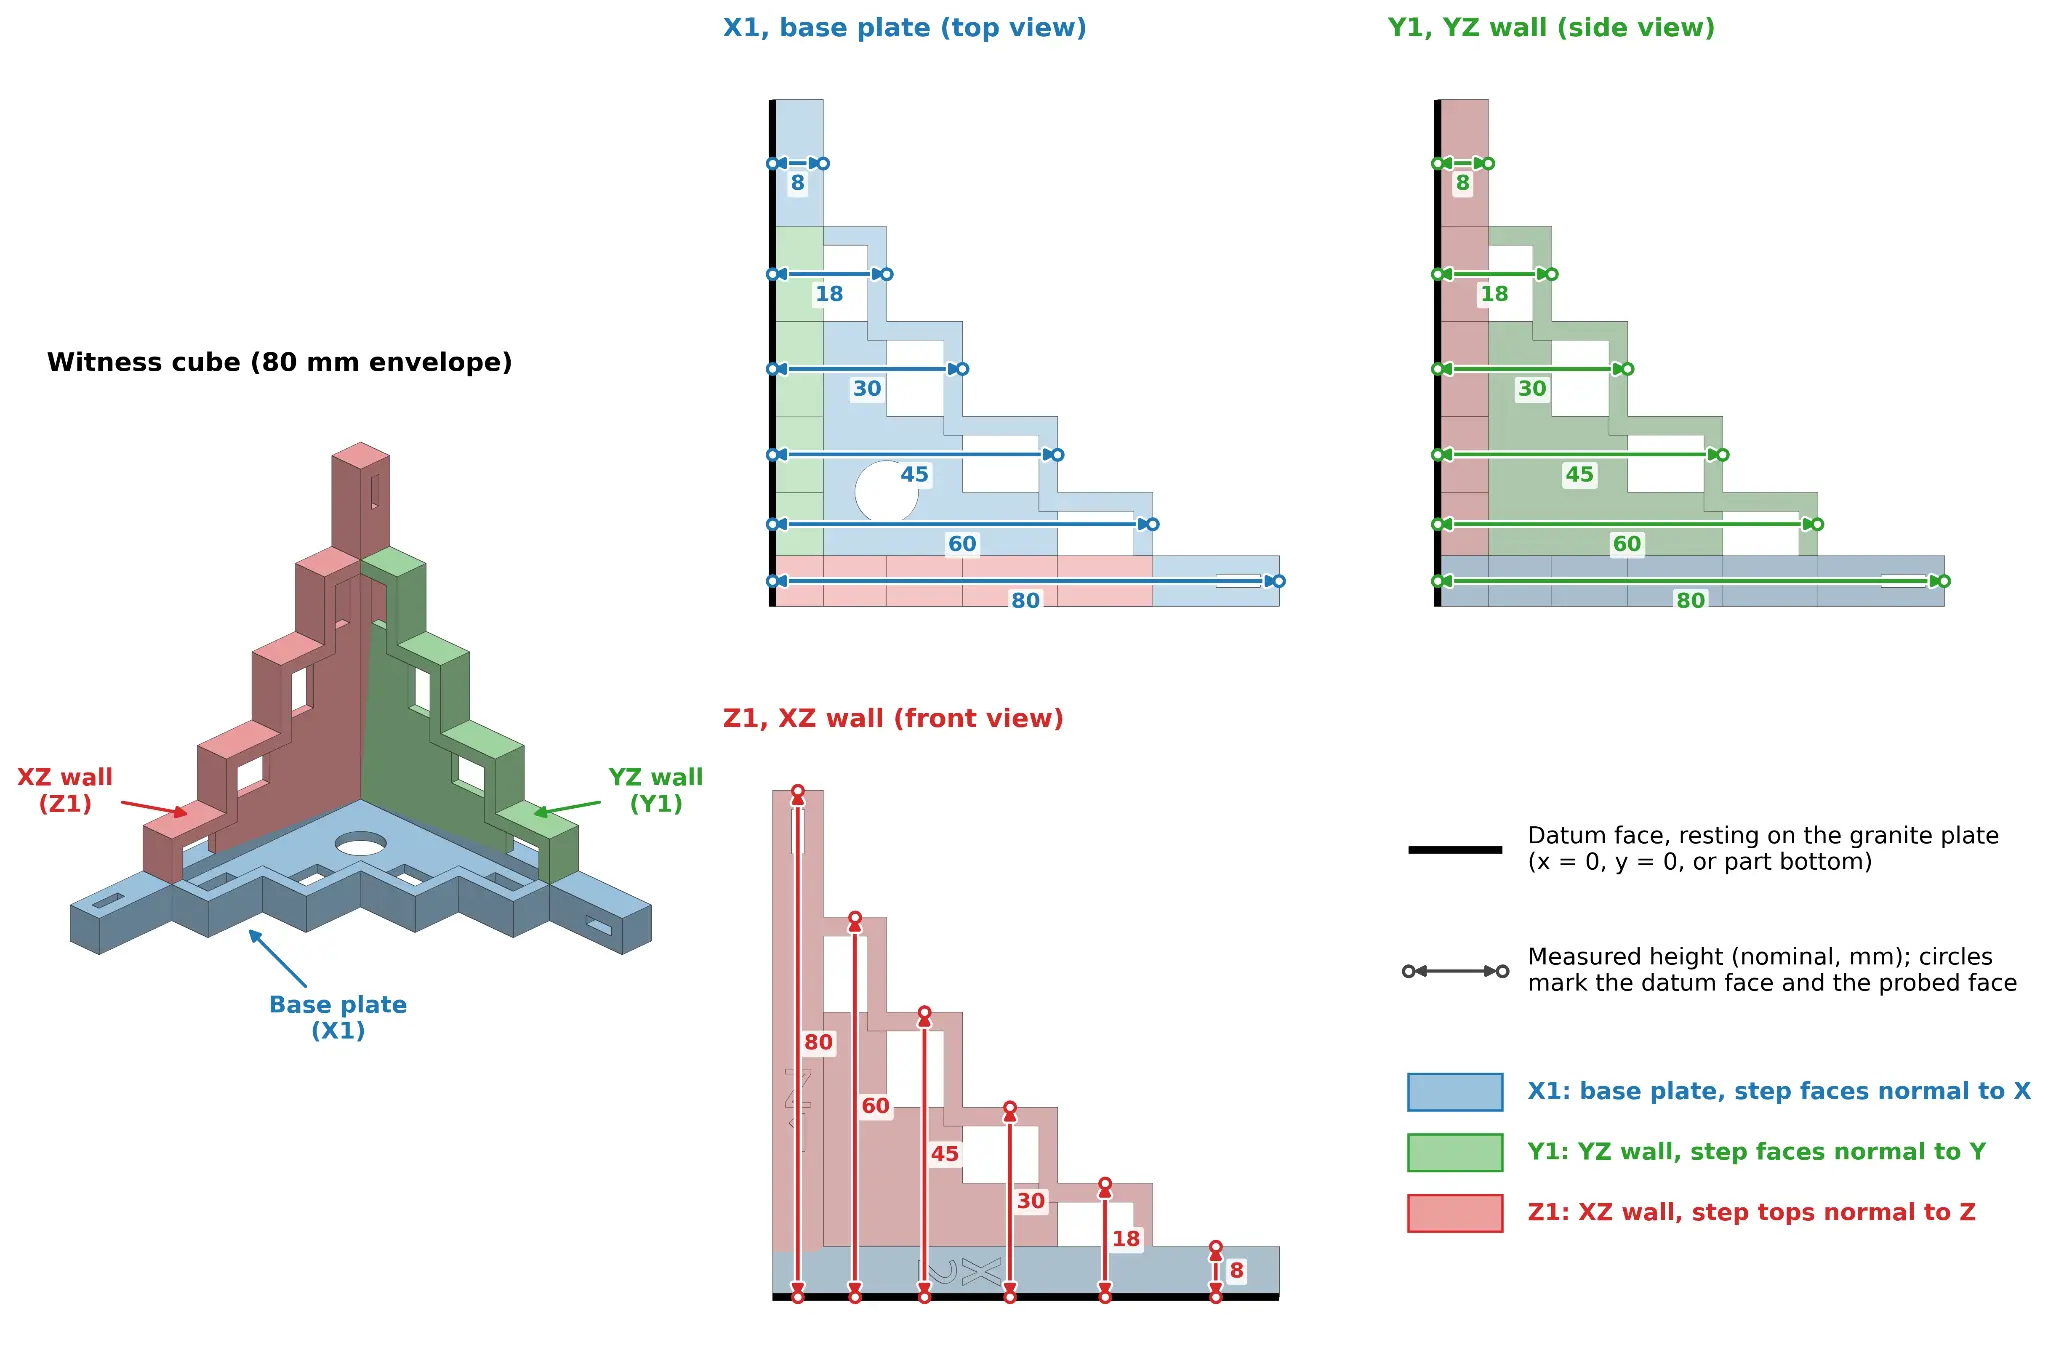
Figure 3. Witness cube and the 18 measured dimensions.
4.2 Builds
Builds of witness cubes were ordered from service bureaus using an EOS P396 and an HP Jet Fusion 5620. Their build chambers were packed using PreForm's automatic packing feature. Fuse X1 builds were printed in-house across four factory-configured printers, used as received with no dimensional tuning.
The Fuse X1 data set intentionally includes both full chambers of witness cubes and production builds with witness cubes packed alongside other parts. Build layout influences the thermal history of each part, layer times, and powder cake structure, all of which can contribute to dimensional variation. Including a range of build configurations helps demonstrate that the results are not dependent on specially optimized test builds, and that users can expect comparable accuracy and repeatability under typical production conditions.
|
Platform |
Builds |
Printers |
Parts measured |
Measurements |
|---|---|---|---|---|
|
Fuse X1 |
14 |
4 |
467 |
8406 |
|
EOS P396 |
2 |
Unknown (1 service bureau) |
328 |
5904 |
|
HP Jet Fusion 5620 |
3 |
Unknown (1 service bureau) |
377 |
6779 |
Table 2. Data set (total parts and measurements, after the outlier screen in Section 4.4).
Fuse X1 builds
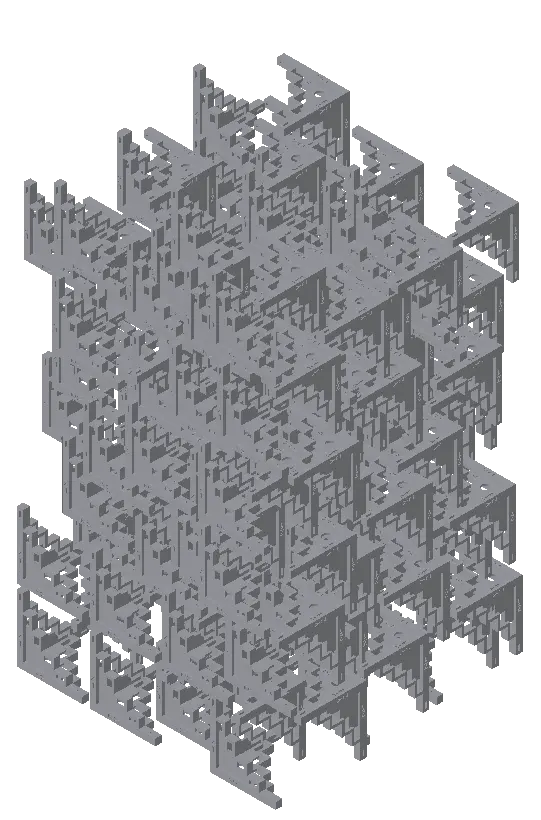
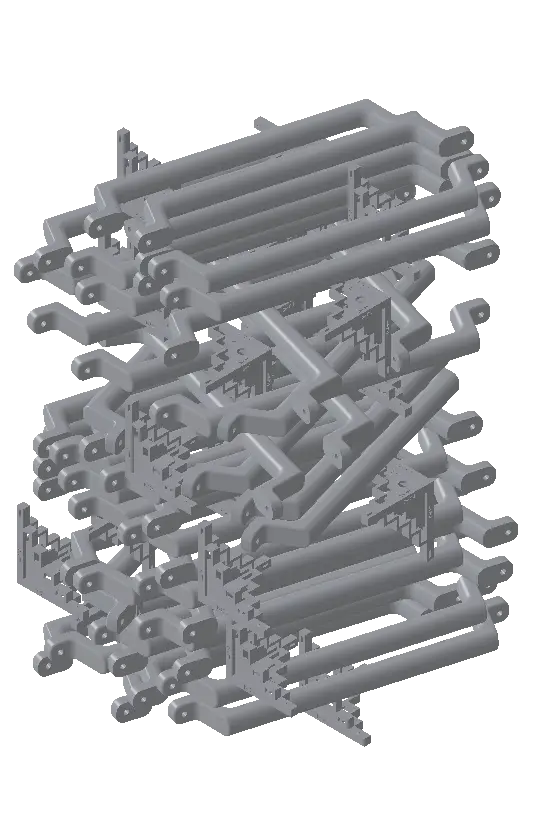
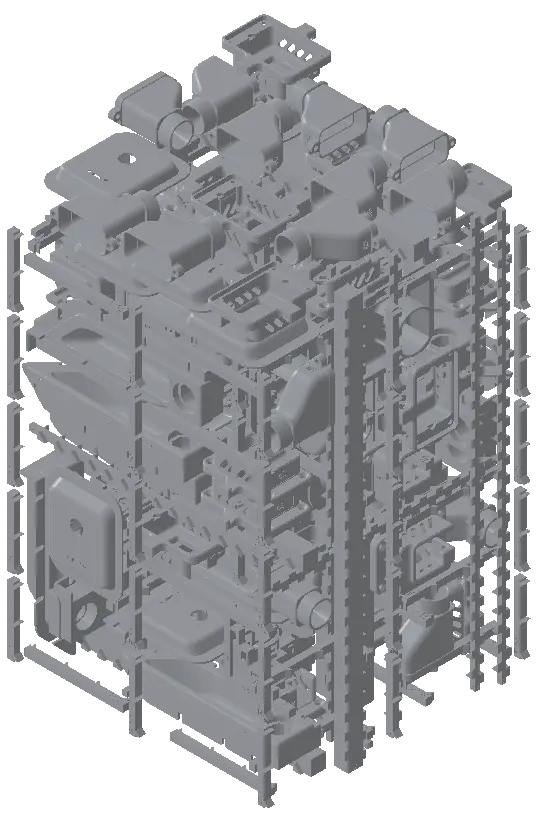
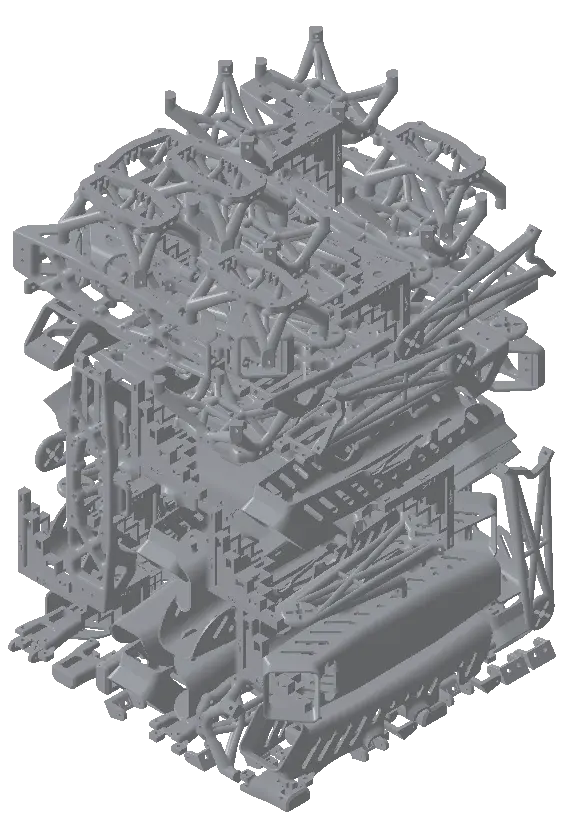
EOS P396 build (left) and HP Jet Fusion 5620 build (right)
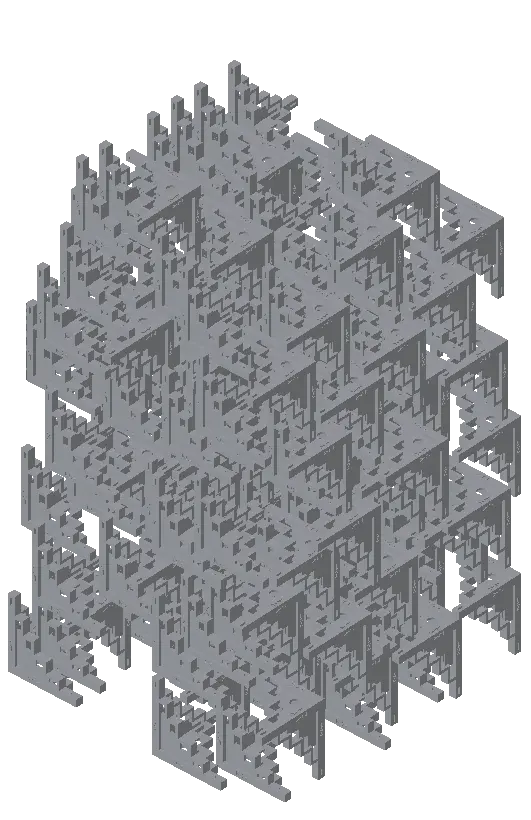
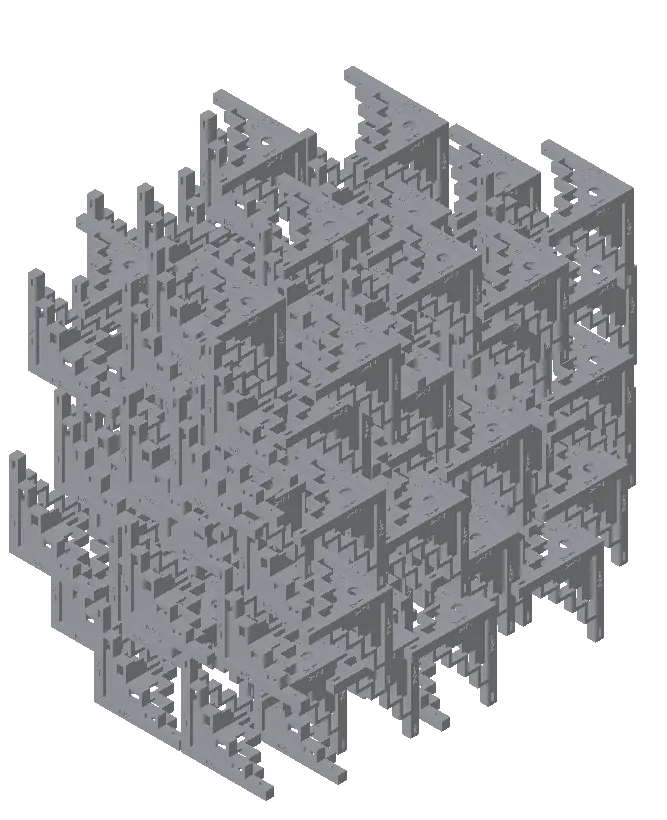
Figure 4. Build layouts.
4.3 Measurement
All witness cubes were measured with a TESA-HITE MAGNA 700 height gauge on a granite block. Each cube rested on the outer datum face of the plate being measured, with the probe touching each step face (Figure 3). Fuse X1 builds were allowed to cool to 60 °C before unpacking, and the witness cubes were depowdered with Fuse Blast.
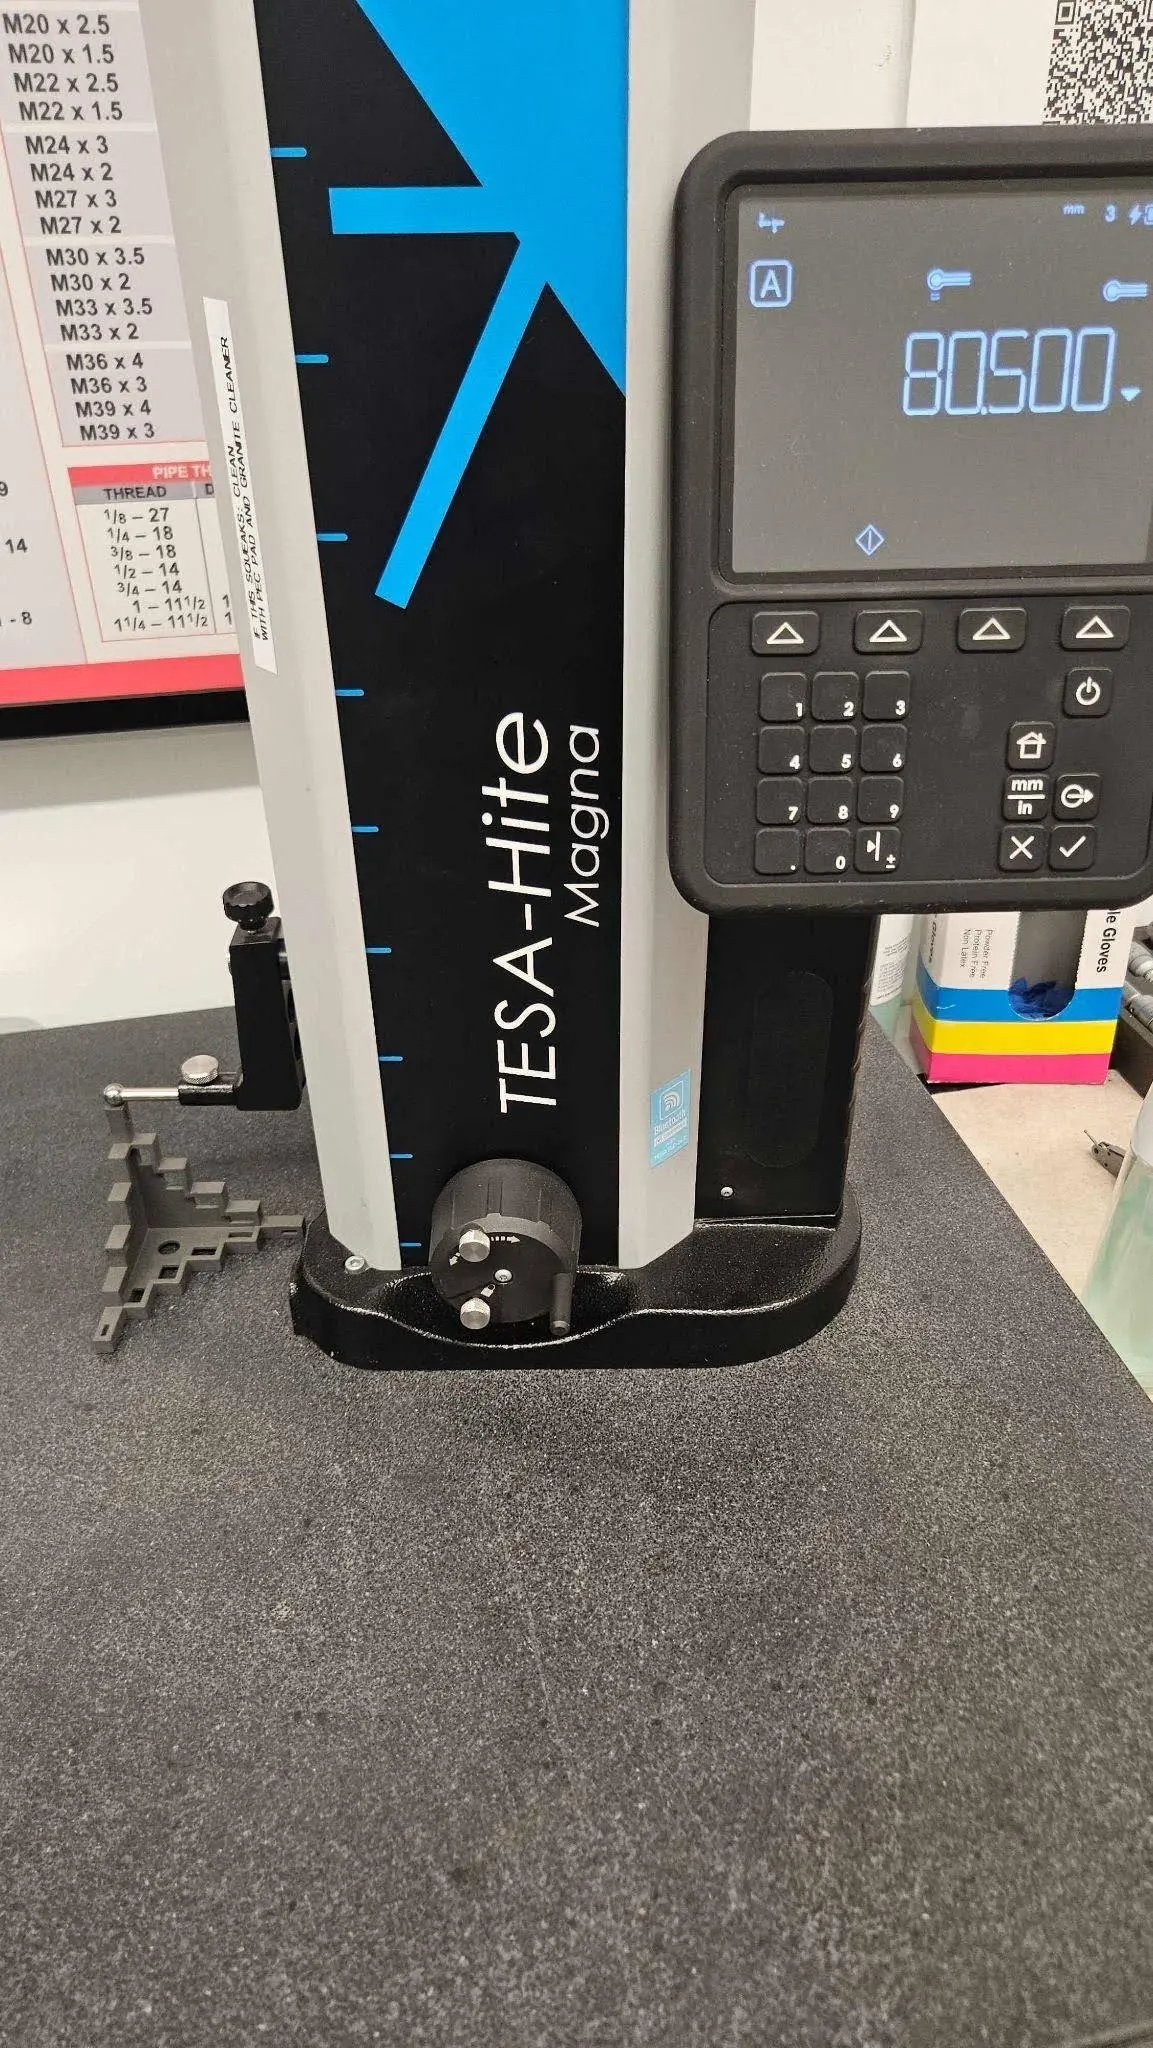
Figure 5. Height-gauge measurement setup.
4.4 Data Treatment
-
Outliers: Readings were excluded only when they met both of the following criteria: they were statistical outliers relative to their build population (>4 robust σ) and deviated by more than 0.3 mm (>5 robust σ) from the same part's measurements at other nominal sizes. This combination of criteria was used to identify likely measurement or transcription errors rather than genuine process variation. Seven competitor readings were excluded (Appendix A).
-
Best case (after-the-fact correction): Scaling and offset corrections are common calibration tools in SLS workflows. Scale factors compensate for material shrinkage and are typically configured during build preparation, while offsets compensate for the width of the sintered edge. In normal operation, these settings are calibrated periodically and held constant across multiple builds.
For this study, we also evaluated a more generous correction method to give each platform its best possible result. Each build received independent offset and scale corrections in all three axes (X, Y, and Z), fitted by least squares to that build's measured dimensions using the model:
Error ≈ Offset + Scale × Nominal
The resulting corrections were then applied retrospectively to all parts in that build. Because these corrections are calculated using measurements from the very build they correct, they cannot be determined or applied by a user before printing. This analysis therefore represents the theoretical upper limit of what calibration could achieve for each platform, rather than the dimensional accuracy users should expect in normal operation.
-
Sample size: The Fuse X1 results represent a broader sample, spanning 4 printers and 14 builds, including production layouts. The EOS P396 and HP Jet Fusion 5620 results are based on 2 and 3 builds, respectively, from a single service bureau per platform. As a result, the competitor data may underrepresent printer-to-printer and build-to-build variation in a multi-printer production environment.
5. Results: Process Capability
Table 3 shows the ± tolerance required for each platform to achieve Cpk 1.33, grouped by HP's nominal dimension ranges, with measurements pooled across all builds. Table 4 presents the same analysis after applying the best-case, after-the-fact offset and scale corrections to each build.
|
Dimension |
Nominal range |
Fuse X1 |
HP 5200 published¹ |
HP Jet Fusion 5620 |
EOS P396 |
|---|---|---|---|---|---|
|
XY |
0–30 mm |
0.26 |
0.25 |
0.49 |
0.27 |
|
XY |
30–50 mm |
0.27 |
0.30 |
0.48 |
0.24 |
|
XY |
50–80 mm |
0.33 |
0.37 |
0.60 |
0.30 |
|
Z |
0–30 mm |
0.34 |
0.42 |
0.62 |
0.55 |
|
Z |
30–50 mm |
0.44 |
0.50 |
0.85 |
0.65 |
|
Z |
50–80 mm |
0.67 |
0.60 |
1.22 |
0.97 |
Table 3. ± tolerance [mm] for Cpk 1.33, as printed.
¹HP 3D HR PA 12 S, general dimensional profile, from HP's Jet Fusion 5200 Series dimensional capability white paper.
|
Dimension |
Nominal range |
Fuse X1 |
HP 5200 published¹ |
HP Jet Fusion 5620 |
EOS P396 |
|---|---|---|---|---|---|
|
XY |
0–30 mm |
0.18 |
0.25 |
0.24 |
0.18 |
|
XY |
30–50 mm |
0.20 |
0.30 |
0.29 |
0.18 |
|
XY |
50–80 mm |
0.27 |
0.37 |
0.38 |
0.24 |
|
Z |
0–30 mm |
0.33 |
0.42 |
0.55 |
0.30 |
|
Z |
30–50 mm |
0.42 |
0.50 |
0.69 |
0.35 |
|
Z |
50–80 mm |
0.54 |
0.60 |
0.90 |
0.63 |
Table 4. ± tolerance [mm] for Cpk 1.33, best case (after-the-fact per-build X/Y/Z offset and scale correction).
¹HP 3D HR PA 12 S, general dimensional profile, from HP's Jet Fusion 5200 Series dimensional capability white paper. Published values are unchanged.
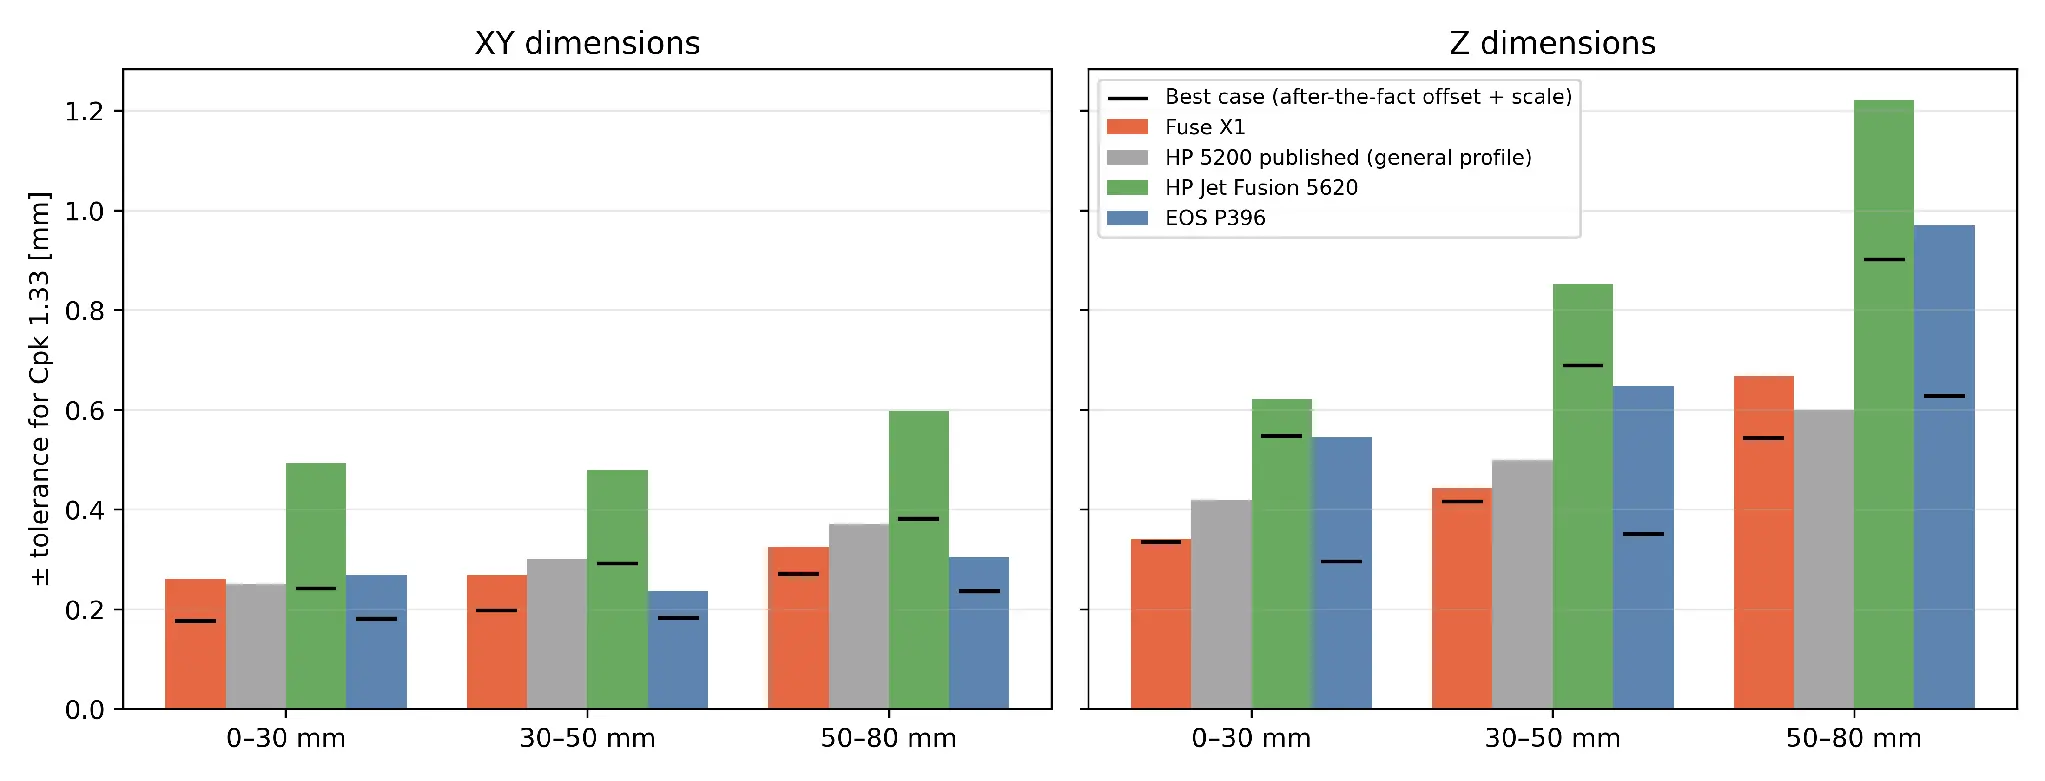
Figure 6. ± tolerance for Cpk 1.33 by nominal range. Bars: as printed; black marks: best case.
As-printed performance
Fuse X1 and the EOS P396 demonstrate comparable X/Y performance, both aligning with HP's published general accuracy profile. The HP Jet Fusion 5620 measured in this study requires roughly twice the tolerance, largely due to build-to-build variation in its X/Y offset (0.04–0.30 mm).
In Z, required tolerances increase with feature size across all platforms, but Fuse X1 consistently requires the least. For features measuring 50–80 mm, Fuse X1 requires ±0.67 mm, compared with ±0.97 mm for the EOS P396 and ±1.22 mm for the HP Jet Fusion 5620.
Best-case corrected performance
After applying the after-the-fact offset and scale corrections, the EOS P396 matches or slightly outperforms Fuse X1 in X/Y (±0.18–0.24 mm versus ±0.18–0.27 mm) and in Z for features up to 50 mm. However, Fuse X1 retains the lowest Z tolerance for larger features (50–80 mm), requiring ±0.54 mm compared with ±0.63 mm for the EOS P396.
The EOS P396 benefits most from these corrections because its dimensional error is dominated by a highly consistent bias across both builds: an offset of +0.11 to +0.14 mm in X/Y and +0.24 mm in Z, alongside a −0.2% X/Y scale error. These systematic errors are well suited to calibration.
Fuse X1 benefits least in Z because its measurements are already centered close to nominal, leaving less systematic error to correct. The HP Jet Fusion 5620 improves in X/Y after correction but continues to require the widest Z tolerance.
|
Dimension |
Nominal range |
Fuse X1 |
HP 5200 published¹ |
HP Jet Fusion 5620 |
EOS P396 |
|---|---|---|---|---|---|
|
XY |
0–30 mm |
0.21 |
0.19 |
0.40 |
0.22 |
|
XY |
30–50 mm |
0.21 |
0.23 |
0.39 |
0.19 |
|
XY |
50–80 mm |
0.25 |
0.28 |
0.47 |
0.23 |
|
Z |
0–30 mm |
0.26 |
0.34 |
0.48 |
0.47 |
|
Z |
30–50 mm |
0.34 |
0.40 |
0.68 |
0.56 |
|
Z |
50–80 mm |
0.52 |
0.47 |
0.97 |
0.81 |
Table 5. ± tolerance [mm] for Cpk 1.00, as printed.
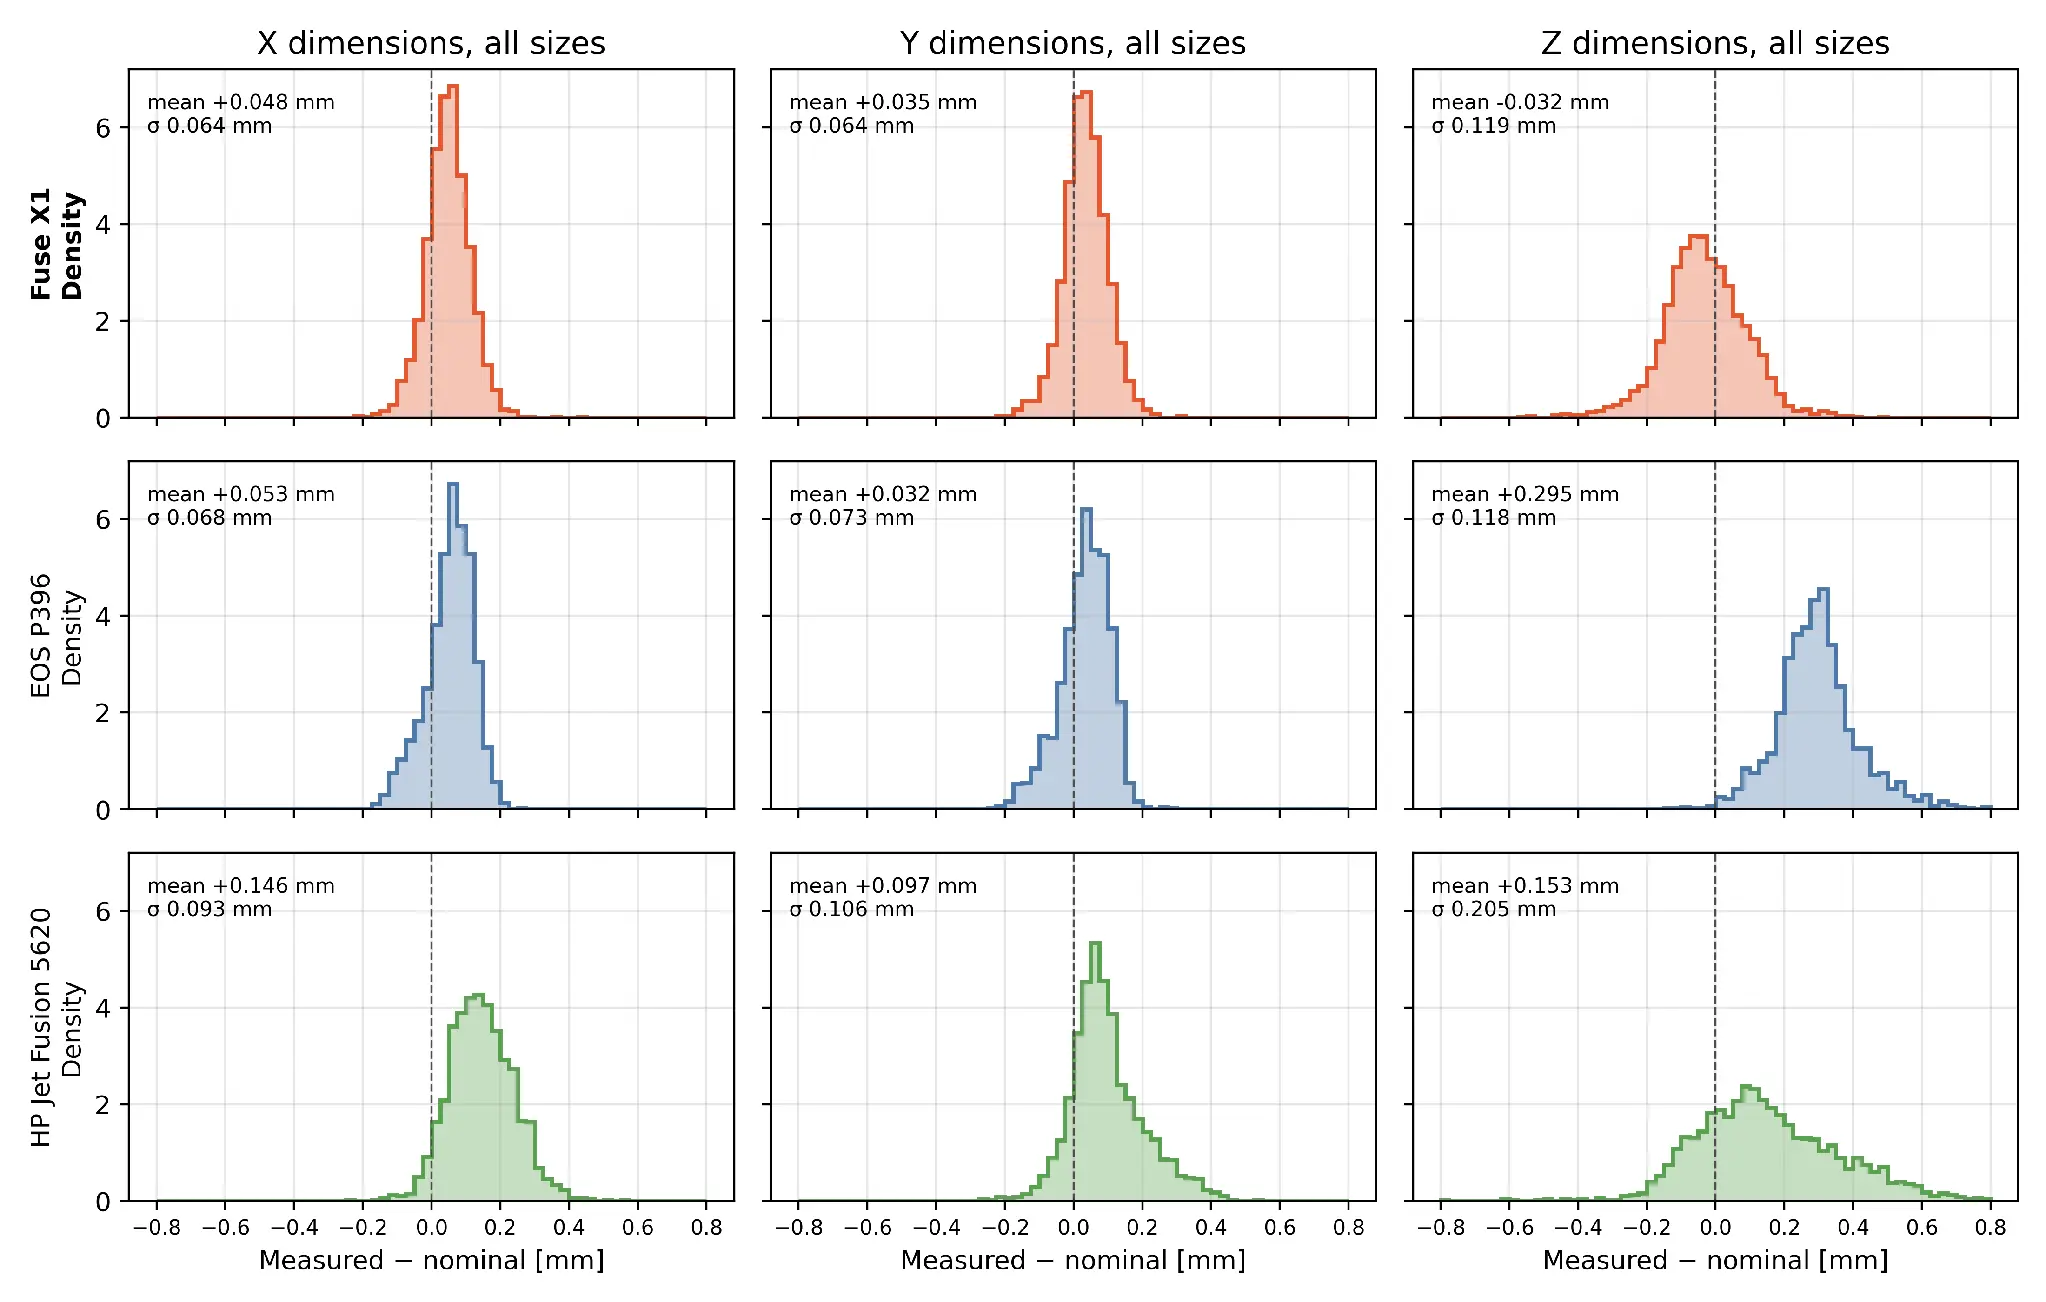
Figure 7. Distribution of measured − nominal for all sizes, by platform, as printed.
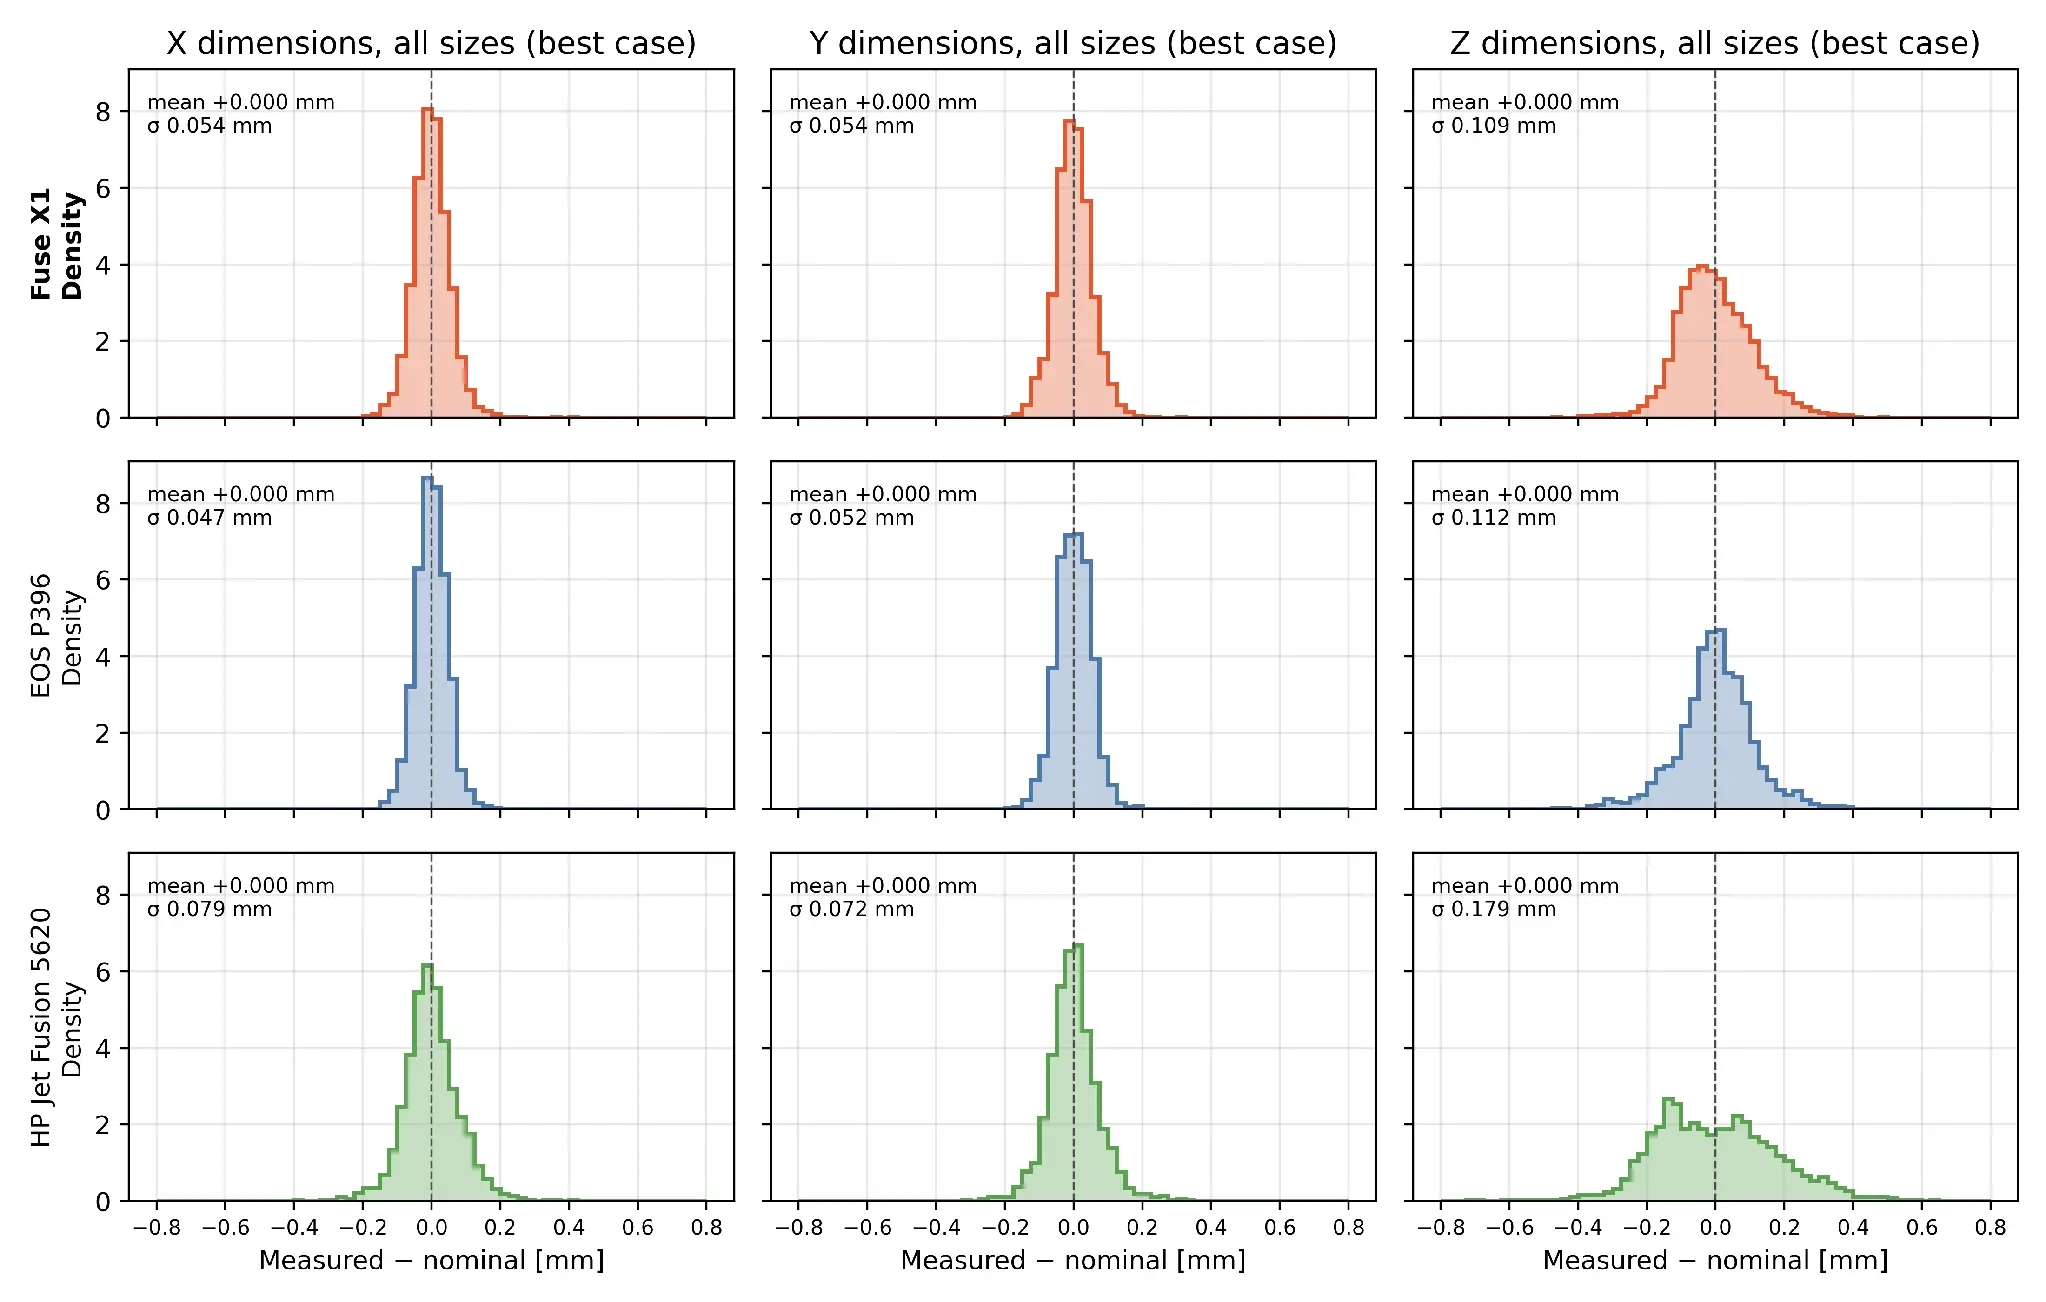
Figure 8. Distribution of measured − nominal for all sizes, by platform, with the after-the-fact offset and scale correction (best case).
6. Results: Part Yield Versus Tolerance
Cpk evaluates the capability of individual dimensions, but for production, the more important question is whether every critical dimension of a part meets tolerance simultaneously. In this analysis, a part passes only if all 18 measured dimensions fall within the specified tolerance band; a single out-of-tolerance dimension results in a failed part.
Two tolerance bands are evaluated:
-
Standard SLS tolerance: The larger of ±0.3 mm or ±0.5% of the nominal dimension.
-
Tight tolerance: The larger of ±0.2 mm or ±0.3% of the nominal dimension.
|
Platform |
Parts |
±0.3 mm or ±0.5%: as printed |
±0.3 mm or ±0.5%: best case |
±0.2 mm or ±0.3%: as printed |
±0.2 mm or ±0.3%: best case |
|---|---|---|---|---|---|
|
Fuse X1 |
467 |
93% |
96% |
70% |
79% |
|
EOS P396 |
328 |
30% |
97% |
3% |
72% |
|
HP Jet Fusion 5620 |
377 |
44% |
79% |
11% |
38% |
Table 6. Part yield: share of parts with all 18 dimensions in tolerance, all builds pooled. Best case: after-the-fact per-build offset and scale correction.
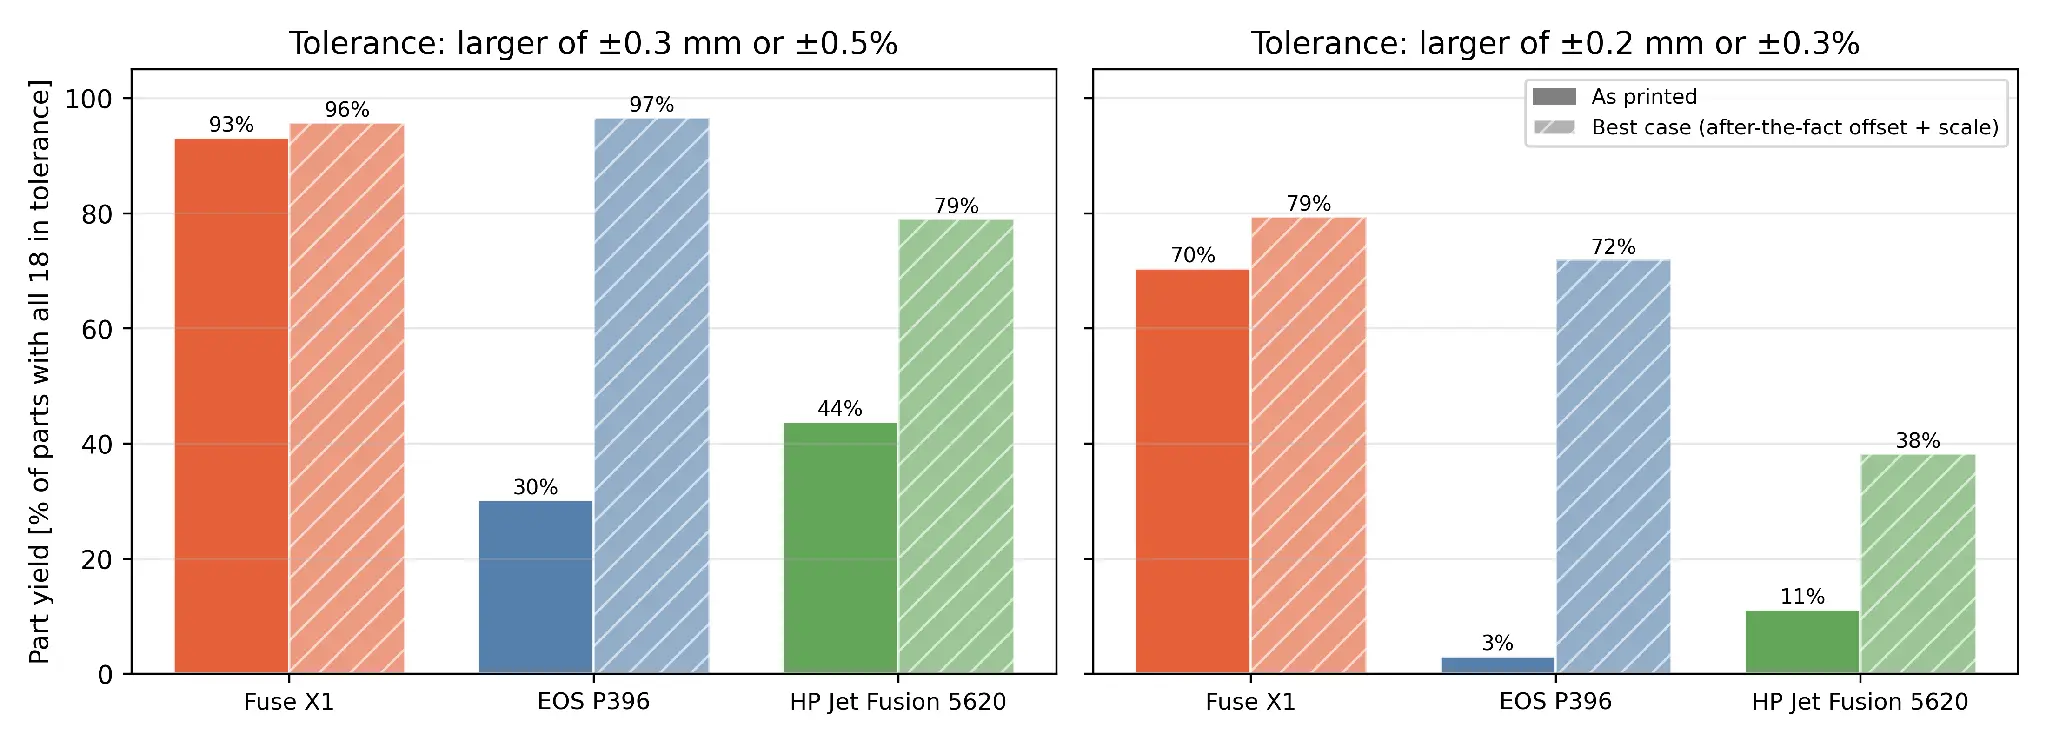
Figure 9. Part yield at the two tolerance bands, as printed and best case.
As-printed production yield
At the standard tolerance (±0.3 mm or ±0.5%), Fuse X1 achieved a part-level yield of 90–100% across builds containing at least 10 witness cubes. This compares with 24–36% for the EOS P396 and 41–46% for the HP Jet Fusion 5620.
The reasons for failure differ by platform. The EOS P396 fails primarily due to a consistent oversize bias, particularly in Z, while the HP Jet Fusion 5620 experiences failures across both Z and X/Y dimensions.
Best-case corrected production yield
After applying the after-the-fact offset and scale corrections, EOS yield increases substantially to 97% at the standard tolerance and 72% at the tight tolerance. Removing its systematic dimensional bias eliminates the primary source of its failures.
Fuse X1 reaches 96% yield at the standard tolerance and 79% at the tight tolerance, retaining the highest yield under the tighter requirement.
The HP Jet Fusion 5620 improves to 79% and 38%, respectively, but continues to trail both platforms. Its remaining failures are primarily driven by part-to-part variation, which cannot be eliminated through per-build offset and scale corrections.
Key takeaway
Fuse X1 delivers the highest as-printed production yield and retains the strongest performance under tight tolerances, even when competitors receive best-case after-the-fact calibration corrections.
7. Results: Dimensional Capability Versus IT Grades
Table 7 converts the Cpk 1.33 tolerance at each nominal size into the tightest ISO 286 IT grade it satisfies. Figure 10 plots the required tolerance against the IT grade bands, as printed (top) and for the best case (bottom).
|
Platform |
Dimension |
8 mm |
18 mm |
30 mm |
45 mm |
60 mm |
80 mm |
|---|---|---|---|---|---|---|---|
|
Fuse X1 |
XY |
IT14 (IT13) |
IT13 (IT12) |
IT13 (IT12) |
IT13 (IT12) |
IT13 (IT12) |
IT13 (IT12) |
|
Fuse X1 |
Z |
IT14 |
IT14 |
IT14 |
IT14 |
IT14 |
IT14 |
|
EOS P396 |
XY |
IT14 (IT13) |
IT13 (IT12) |
IT13 (IT12) |
IT12 |
IT12 |
IT12 |
|
EOS P396 |
Z |
IT15 (IT14) |
IT15 (IT13) |
IT15 (IT13) |
IT15 (IT14) |
IT15 (IT14) |
IT15 |
|
HP Jet Fusion 5620 |
XY |
IT15 (IT14) |
IT15 (IT13) |
IT14 (IT13) |
IT14 (IT13) |
IT14 (IT13) |
IT14 (IT13) |
|
HP Jet Fusion 5620 |
Z |
IT15 |
IT15 |
IT15 |
IT15 |
IT15 |
IT16 (IT15) |
Table 7. Tightest IT grade achieved at Cpk 1.33 for each nominal size, as printed (best case in parentheses where different).
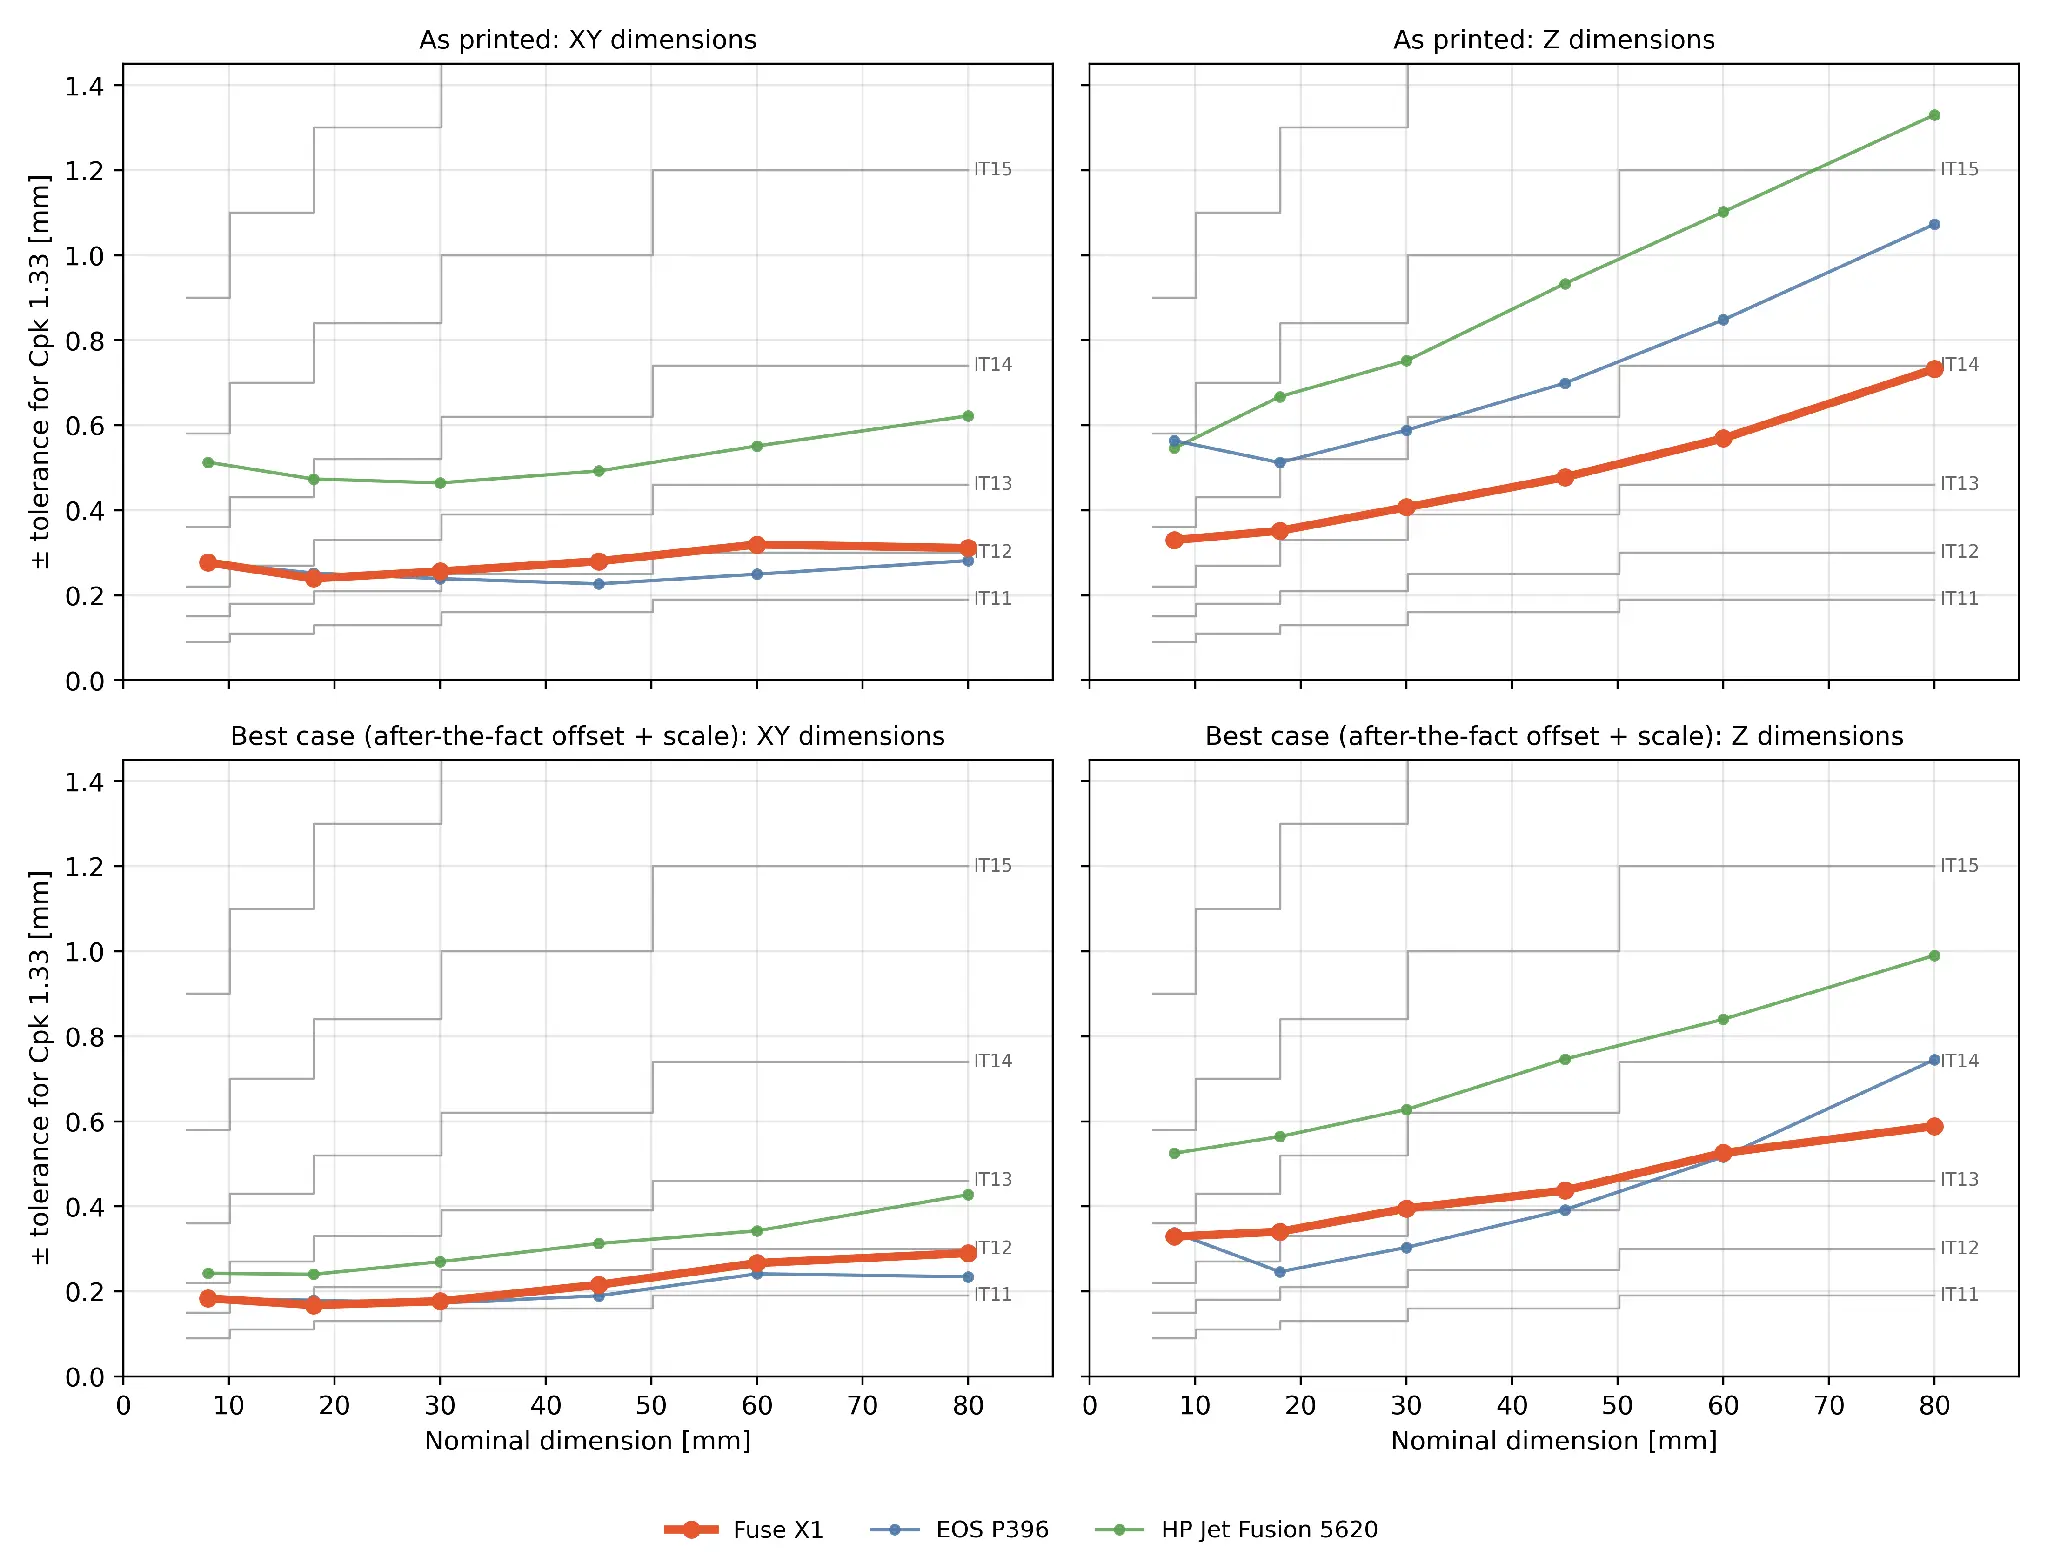
Figure 10. ± tolerance for Cpk 1.33 versus nominal size, against ISO 286 IT grade bands. Top: as printed; bottom: best case (after-the-fact offset and scale correction). Fuse X1 is shown in bold.
As-printed dimensional capability
Fuse X1 achieves ISO 286 tolerance grades of IT13–IT14 in X/Y and IT14 in Z. The EOS P396 matches or slightly outperforms Fuse X1 in X/Y (IT12–IT14) but requires a looser tolerance grade in Z (IT15). The HP Jet Fusion 5620 measured in this study achieves IT14–IT15 in X/Y and IT15–IT16 in Z.
For Fuse X1 and the EOS P396, the 8 mm X/Y features fall one tolerance grade below their larger features. This reflects the behavior of the ISO 286 tolerance system: allowable tolerances decrease with feature size, while components of measured error, such as surface texture and measurement resolution, do not necessarily decrease proportionally.
Best-case corrected performance
After applying the after-the-fact offset and scale corrections, Fuse X1 reaches IT12–IT13 in X/Y and IT14 in Z. The EOS P396 reaches IT12–IT13 in X/Y and IT13–IT15 in Z, while the HP Jet Fusion 5620 reaches IT13–IT14 in X/Y and IT15 in Z.
Key takeaway
Fuse X1 delivers consistent IT13–IT14 performance in X/Y and IT14 in Z straight out of the printer, with particularly strong Z accuracy relative to the competing platforms.
8. Fuse X1 Repeatability: What To Expect in Production
This section focuses exclusively on Fuse X1 performance. With 14 builds across 4 printers and repeated chamber positions across builds, the data set is large enough to distinguish the sources of dimensional variation and characterize expected performance at three levels: within a single printer, across a fleet of printers, and at the limit of repeatability. The competitor data sets are too limited to support the same level of analysis.
8.1 Where the Variation Comes From
The variation of every measured feature was split into four sources:
-
Printer to printer: How much the average size of a feature differs from one printer to another.
-
Build to build: How much the average size of a feature differs from one build to the next on the same printer. This measures the stability of the system over time.
-
Within a build, repeatable by position: Differences between parts in the same build that come back at the same chamber position in every build. They come from each location's thermal history, such as its height in the build and its distance from the chamber walls, and are predictable.
-
Within a build, random: The remaining part-to-part scatter, from sources such as powder, surface texture, and measurement repeatability.
Each share is calculated for each nominal size and pooled across the size range. The positional share is estimated from how much the same position varies across builds, relative to the total variation within a build.
|
Axis |
Nominal range |
Overall σ [mm] |
Printer to printer |
Build to build |
Within build: by position |
Within build: random |
|---|---|---|---|---|---|---|
|
X |
0–30 mm |
0.05 |
21% |
8% |
43% |
28% |
|
X |
30–50 mm |
0.05 |
21% |
5% |
36% |
38% |
|
X |
50–80 mm |
0.07 |
17% |
7% |
35% |
41% |
|
Y |
0–30 mm |
0.05 |
25% |
10% |
41% |
23% |
|
Y |
30–50 mm |
0.05 |
15% |
9% |
40% |
36% |
|
Y |
50–80 mm |
0.07 |
8% |
7% |
43% |
42% |
|
Z |
0–30 mm |
0.08 |
1% |
4% |
80% |
16% |
|
Z |
30–50 mm |
0.11 |
3% |
6% |
70% |
22% |
|
Z |
50–80 mm |
0.15 |
5% |
11% |
56% |
27% |
Table 8. Sources of Fuse X1 dimensional variation (share of variance).
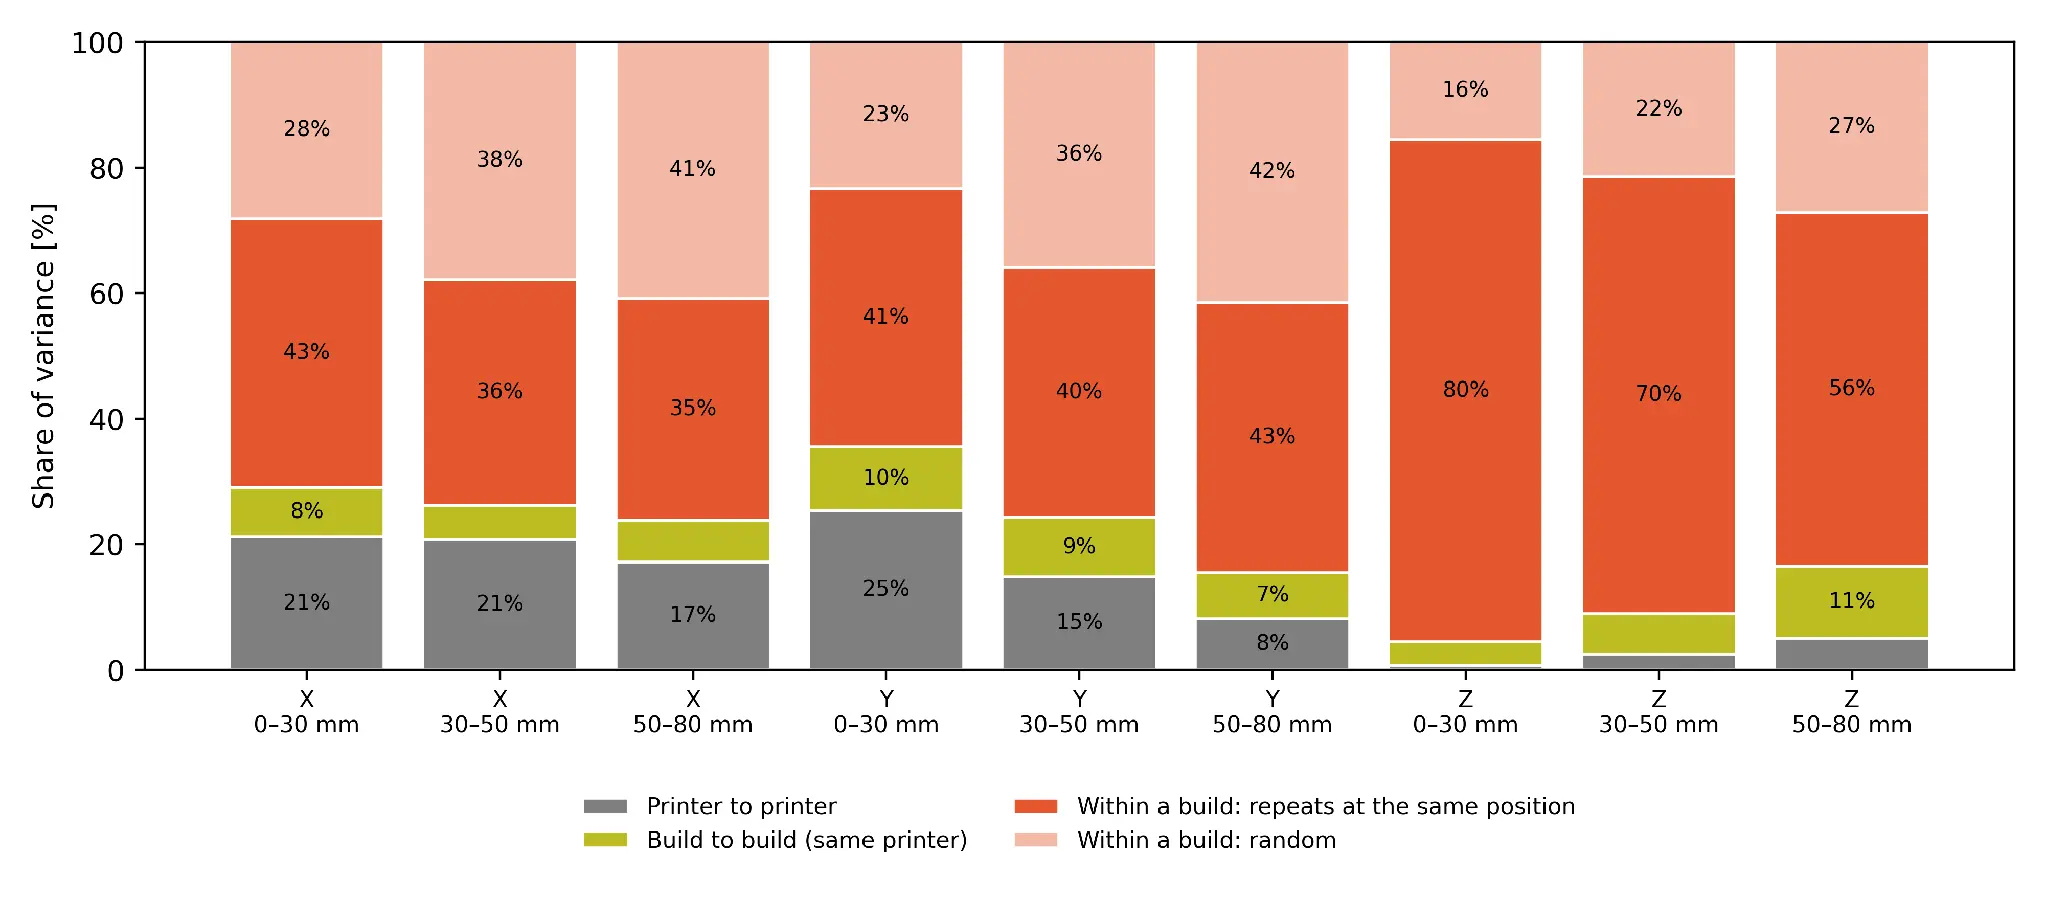
Figure 11. Share of Fuse X1 variance by source, for each axis and nominal range.
Most of the variation occurs within a single build. In Z, 56–80% of the variance repeats at the same chamber position, and in X/Y, 35–43%. Differences between printers account for 8–25% of X/Y variance and 5% or less in Z, and differences between builds on the same printer account for 4–11%.
8.2 What This Means for Fuse X1 Users
Table 9 and Figure 12 translate these sources into the Cpk 1.33 tolerance a Fuse X1 user can expect in four situations.
|
Axis |
Nominal range |
Fleet of printers, as printed |
One printer, as printed |
One printer, one-time scale calibration |
Same position, repeated builds |
|---|---|---|---|---|---|
|
XY |
0–30 mm |
±0.26 |
±0.17–0.30 |
±0.17–0.28 |
±0.12 |
|
XY |
30–50 mm |
±0.27 |
±0.21–0.28 |
±0.19–0.24 |
±0.13 |
|
XY |
50–80 mm |
±0.33 |
±0.27–0.35 |
±0.27–0.33 |
±0.19 |
|
Z |
0–30 mm |
±0.34 |
±0.32–0.37 |
±0.32–0.37 |
±0.13 |
|
Z |
30–50 mm |
±0.44 |
±0.41–0.50 |
±0.38–0.51 |
±0.21 |
| Z | 50–80 mm |
±0.67 |
±0.61–0.69 |
±0.57–0.59 |
±0.33 |
Table 9. ± tolerance [mm] for Cpk 1.33 that a Fuse X1 user can expect. Single-printer values give the range across the 3 printers with at least 50 cubes measured.
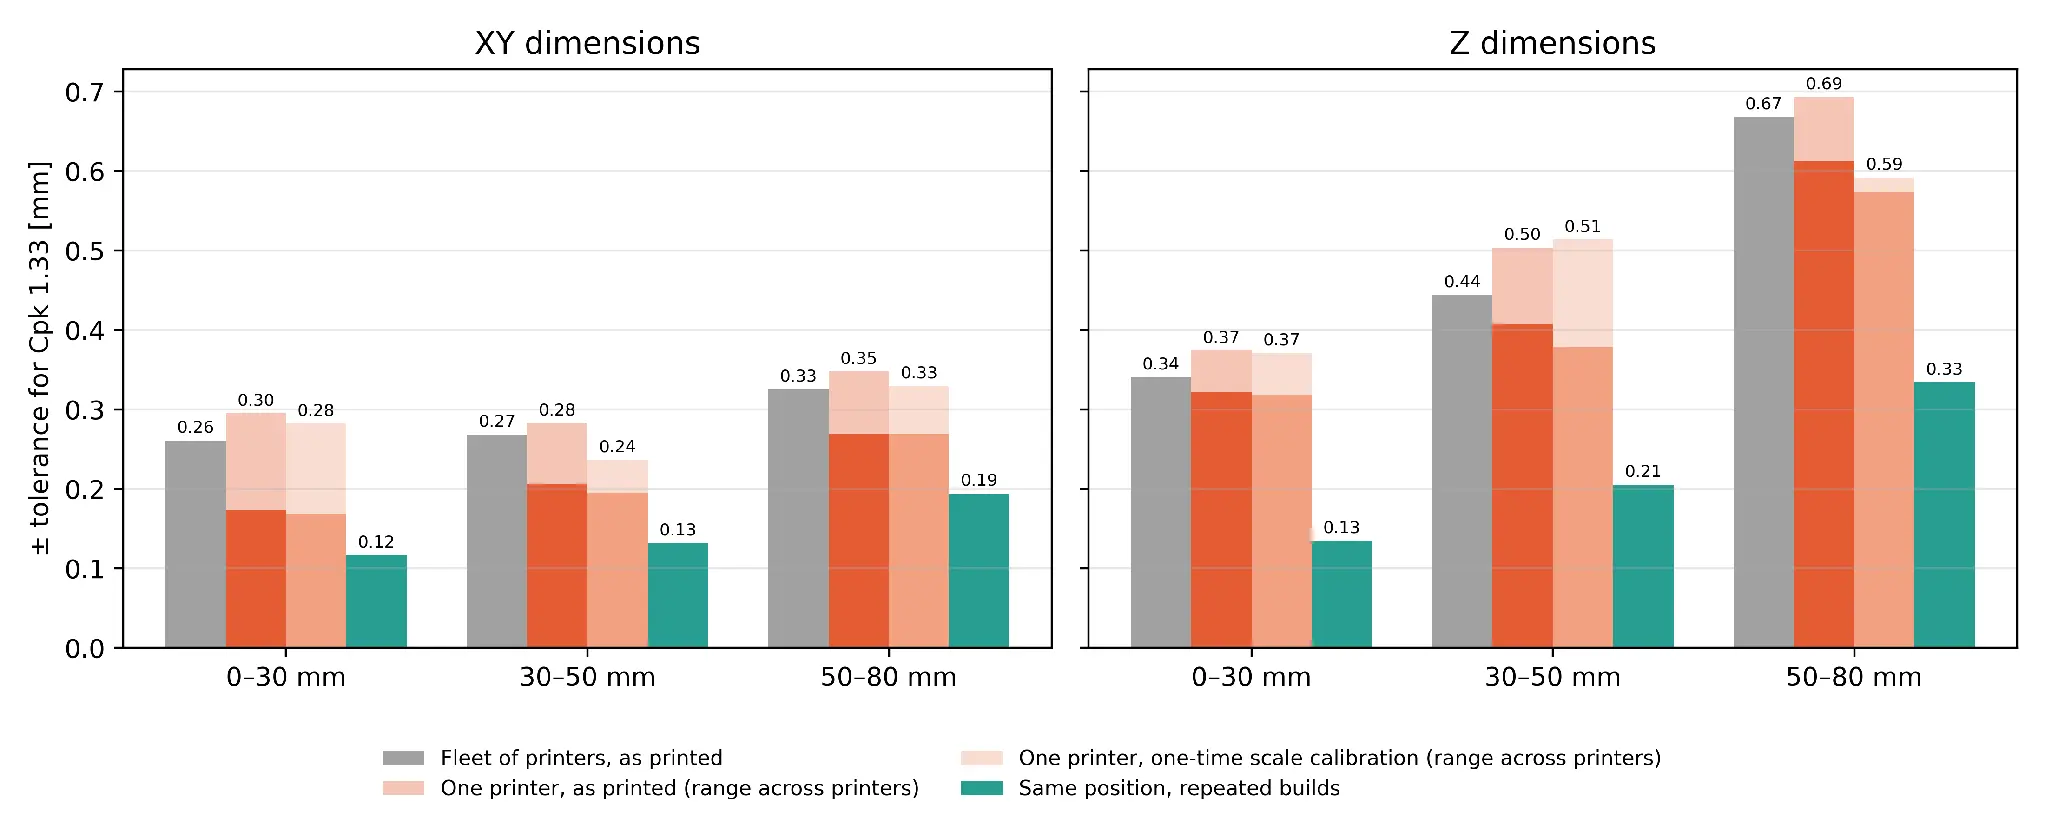
Figure 12. Cpk 1.33 tolerance for a Fuse X1 user. Light bars show the range across printers.
-
Running one printer: A single Fuse X1 printer required a Cpk 1.33 tolerance of ±0.17–0.35 mm in X/Y and ±0.32–0.69 mm in Z, depending on the printer and feature size.
-
Running a fleet: All four printers were used as delivered from the factory, with no dimensional tuning, and demonstrated comparable performance. At every feature size, the tolerance required for the combined fleet fell within the range of the individual printers. Average scale differences between printers were no greater than approximately 0.12%, equivalent to roughly 0.10 mm on an 80 mm feature. A one-time scale calibration of each printer, using the on-printer scale setting, removes most of this difference and slightly improves dimensional capability. For a single calibrated printer, the required tolerance narrows to ±0.17–0.33 mm in X/Y and ±0.32–0.59 mm in Z.
-
Build-to-build stability: On the same printer, the average dimension of a given feature varied by just 0.02–0.07 mm (one standard deviation) between builds, even across different build layouts. This demonstrates strong dimensional stability across successive builds and typical production configurations.
-
The limit: Same position across repeated builds. Parts printed in the same chamber position, build after build, on the same printer showed a standard deviation of just 0.03–0.08 mm. When the small, repeatable positional offsets are compensated, the required Cpk 1.33 tolerance drops to ±0.12–0.19 mm in X/Y and ±0.13–0.33 mm in Z — roughly half the tolerance required for an uncalibrated fleet. High-volume users producing the same parts repeatedly can approach this level of performance by maintaining a fixed build layout and applying position-specific model adjustments based on an initial build.
Methodology notes
The one-time calibration uses a single scale factor per printer and axis, applied across all builds from that printer and fitted to the study data.
The same-position repeatability analysis uses 115 chamber positions repeated across builds on three printers.
9. Results Summary
Fuse X1 delivers industry-leading Z accuracy and the highest as-printed part yield, with consistent performance across printers and significant additional potential for high-volume production.
-
X/Y accuracy: Fuse X1 requires ±0.26–0.33 mm tolerance to achieve Cpk 1.33 across 8–80 mm features. This is comparable to the EOS P396 (±0.24–0.30 mm) and HP's published general-profile capability (±0.25–0.37 mm), and requires roughly half the tolerance measured on the HP Jet Fusion 5620 in this study (±0.48–0.60 mm).
-
Z accuracy: Fuse X1 requires ±0.34–0.67 mm to achieve Cpk 1.33, compared with ±0.55–0.97 mm for the EOS P396 and ±0.62–1.22 mm for the HP Jet Fusion 5620. Fuse X1 demonstrates the best Z accuracy across every feature-size range evaluated of the three printers tested.
-
Part yield: When all 18 measured dimensions must meet tolerance simultaneously, 93% of Fuse X1 parts pass at the standard tolerance (±0.3 mm or ±0.5%), compared with 30% for the EOS P396 and 44% for the HP Jet Fusion 5620. At the tighter tolerance (±0.2 mm or ±0.3%), Fuse X1 achieves 70% yield, compared with 3% and 11%, respectively.
-
Best-case corrected yield: After applying after-the-fact offset and scale corrections fitted to each build's own measurements, Fuse X1 achieves 96% / 79% yield at the standard and tight tolerances, respectively. The EOS P396 reaches 97% / 72%, while the HP Jet Fusion 5620 reaches 79% / 38%. Fuse X1 retains the highest yield under the tighter tolerance.
-
ISO tolerance grades: At Cpk 1.33, Fuse X1 achieves IT13–IT14 in X/Y and IT14 in Z. The EOS P396 achieves IT12–IT14 in X/Y and IT15 in Z, while the HP Jet Fusion 5620 achieves IT14–IT15 in X/Y and IT15–IT16 in Z.
-
Fuse X1 repeatability: When the same chamber position is repeated across builds on a single Fuse X1 printer, compensating for its positional offset enables Cpk 1.33 tolerances of ±0.12–0.19 mm in X/Y and ±0.13–0.33 mm in Z (Section 8). This demonstrates the potential for significantly tighter tolerances in controlled, high-volume production.
|
Platform |
Builds / Total parts |
Cpk 1.33 tol. XY [mm] |
Cpk 1.33 tol. Z [mm] |
Yield, ±0.3 mm or ±0.5% |
Yield, ±0.2 mm or ±0.3% |
IT grade XY / Z (Cpk 1.33) |
|---|---|---|---|---|---|---|
|
Fuse X1 |
14 / 467 |
0.26–0.33 |
0.34–0.67 |
93% (96%) |
70% (79%) |
IT13–IT14 / IT14 |
|
EOS P396 |
2 / 328 |
0.24–0.30 |
0.55–0.97 |
30% (97%) |
3% (72%) |
IT12–IT14 / IT15 |
|
HP Jet Fusion 5620 |
3 / 377 |
0.48–0.60 |
0.62–1.22 |
44% (79%) |
11% (38%) |
IT14–IT15 / IT15–IT16 |
Table 10. Summary, as printed. Yields in parentheses are the best case: each build corrected after the fact with its own fitted X/Y/Z offset and scale (Section 4.4). Tolerances span the 0–30, 30–50, and 50–80 mm nominal ranges.
10. Conclusion and Design Guidance
Fuse X1 delivers X/Y dimensional capability on par with an EOS P396 and HP's published Multi Jet Fusion capability, and the best Z capability of the three platforms tested. As printed, 93% of Fuse X1 witness cubes held every one of 18 dimensions within the larger of ±0.3 mm or ±0.5%, compared with 30% and 44% for the EOS and HP builds. Even when every build is corrected after the fact, which no user can do before printing, Fuse X1 remains comparable to the EOS P396 and ahead of the HP Jet Fusion 5620. Fuse X1 achieves this on four printers as delivered from the factory, across several build layouts, and a part printed in the same position repeats closely from build to build.
Rules of thumb for designing and tuning Fuse X1 parts:
-
Design X/Y features to ±0.3 mm up to 50 mm and ±0.35 mm from 50 to 80 mm. Across the fleet tested, Fuse X1 holds these tolerances at Cpk 1.33 with no part-specific scaling.
-
Allow more tolerance on tall Z features; Z error grows with feature height and build position.
-
When running several printers, a one-time scale calibration of each printer with the on-printer scale setting aligns the fleet. For even more fine-tuned control, Print Settings Editor can be used to tune offsets.
-
For high-volume production of the same part, keep the build layout fixed and compensate each model for its position after a first build to approach ±0.12–0.19 mm in X/Y.
To see all important dimensions and design considerations to keep in mind when designing parts for the Fuse Series printers, read our Fuse Series design guide.
Want to see SLS quality firsthand? Request a sample part, or contact our sales team to get a custom sample part printed on Fuse X1. Have other questions? We’re here to help.